...
...
Presenting Data in Column Groups in a Report
【Question】
Hello people:
i have this data: {AAA , 18} ,{BBB, 10} , {CCC ,20},{DDD, 65}, …….. {SSS, 16}.
i want to show it in the report like that:
AAA 18 DDD 65 GGG 33 ………. SSS 16
BBB 10 EEE 13 …
CCC 20 FFF 98 …
Any idea? , i am using a normal table, but all the data is under , Example :
AAA 18
BBB 10
CCC 20
….
but the thing is that i have several bands, some tables, but just 1 is like the example i showed you, then i was thinking in use a subreport, what do you think?
【Answer】
Suppose that the original data contains 10 records in two fields and the number of column groups colN is 3, then we need to generate a 6-field two-dimensional table. It’s simple to prepare data for reporting in SPL:
| A |
|
| 1 |
=connect(“demo”) |
| 2 |
=A1.query(“SELECT name,value FROM tb”) |
| 3 |
=ceil(A2.len()/colN) |
| 4 |
=A2.group(ceil(#/A3)) |
| 5 |
=create(${colN.(“name”/ ~ /“,value”/ ~).concat@c()})) |
| 6 |
=A5.paste(${A4.len().($[A4(]/ ~ /$[).(#1),A4(]/ ~ /“).(#2)”).concat@c()}) |
Result of executing the SPL script:
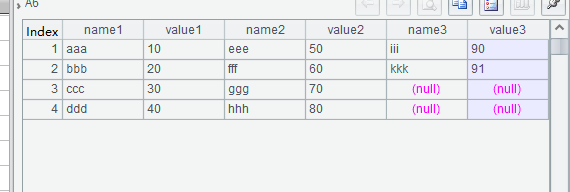
A1: Connect to the database;
A2: Retrieve data we need;
A3: Calculate the number of rows with 3 column groups;
A4: Group the retrieved data;
A5: Create an empty table sequence consisting of name and value fields;
A6: Assign values to each record in A5’s table sequence field by field.
SPL Official Website 👉 http://www.scudata.com
SPL Feedback and Help 👉 https://www.reddit.com/r/esProc
SPL Learning Material 👉 http://c.scudata.com
SPL Source Code and Package 👉 https://github.com/SPLWare/esProc
Discord 👉 https://discord.gg/ydhVnFH9
Youtube 👉 https://www.youtube.com/@esProc_SPL
对润乾产品感兴趣的小伙伴,一定要知道软件还能这样卖哟性价比还不过瘾? 欢迎加入好多乾计划。
这里可以低价购买软件产品,让已经亲民的价格更加便宜!
这里可以销售产品获取佣金,赚满钱包成为土豪不再是梦!
这里还可以推荐分享抢红包,每次都是好几块钱的巨款哟!
来吧,现在就加入,拿起手机扫码,开始乾包之旅

嗯,还不太了解好多乾?