

Overcome SQL Headaches - For Set Operations and Getting Row Numbers
1.Concatenation
Example 1 : Calculate the number of days in overlapping time periods (Count once for overlapping periods).
MySQL8:
with recursive t(start,end) as (select date’2010-01-07’,date’2010-01-9’
union all select date’2010-01-15’,date’2010-01-16’
union all select date’2010-01-07’,date’2010-01-12’
union all select date’2010-01-08’,date’2010-01-11’),
t1(d,end) as (select start,end from t
union all select d+1,end from t1 where d
select count(distinct d) from t1;
Note: First get dates within each time period and then count the number of different dates.
SPL script:
| A | |
|---|---|
| 1 | =connect(“mysql”) |
| 2 | =A1.query@x(“select date’2010-01-07’start,date’2010-01-9’end union all select date’2010-01-15’,date’2010-01-16’union all select date’2010-01-07’,date’2010-01-12’union all select date’2010-01-08’,date’2010-01-11’”) |
| 3 | =A2.(periods(start,end)) |
| 4 | =A3.conj() |
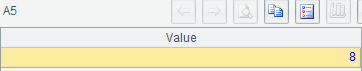
| 5 | =A4.icount() |
A3: Generate a sequence of dates for each time period in A2 from start to end.
A4: Concatenate sequences in A3.
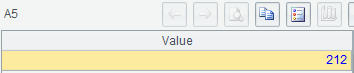
A5: Count the number of different dates in A4.
2.Difference
Example 1 : Find countries where both English-speaking population and French-speaking population exceed 5% of the whole population.
MySQL8:
with t1(lang) as (select ‘English’ union all select ‘French’)
select name from world.country c
where not exists(select * from t1 where lang not in (select language from world.countrylanguage where percentage>=5 and countrycode=c.code));
Note : The SQL just shows how it gets empty difference using two not operators.
SPL script:
| A | |
|---|---|
| 1 | =connect(“mysql”) |
| 2 | =A1.query(“select CountryCode,Name,Language,Percentage from world.countrylanguage cl join world.country c on cl.countrycode=c.code where percentage>5”) |
| 3 | =A2.group(CountryCode) |
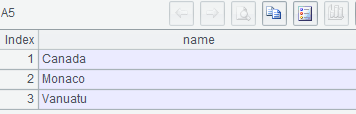
| 4 | =A3.select([“English”,“French”]~.(Language)==[]) |
| 5 | =A4.new(~.Name:name) |
A4: Find groups that the difference between them and [“English”,”French”] is empty, that is, getting groups where languages include English and French.
3. Intersection
Example 1 : Get codes of countries where the English-speaking population, French-speaking population and Spanish-speaking population respectively exceed 0.3%, 0.2% and 0.1%.
MySQL8:
with t1 as (select countrycode from world.countrylanguage where language=‘English’ and percentage>0.3),
t2 as (select countrycode from world.countrylanguage where language=‘French’ and percentage>0.2),
t3 as (select countrycode from world.countrylanguage where language=‘Spanish’ and percentage>0.1)
select countrycode
from t1 join t2 using(countrycode) join t3 using(countrycode);
Note : The above SQL is just an example of calculating intersection of sets.
SPL script:
| A | |
|---|---|
| 1 | =connect(“mysql”) |
| 2 | [English,French,Spanish] |
| 3 | [0.3,0.2,0.1] |
| 4 | =A2.(A1.query@i(“select countrycode from world.countrylanguage where language=? and percentage>?”,~,A3(#))) |
| 5 | >A1.close() |
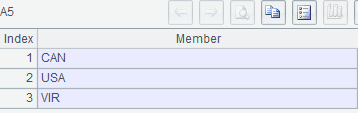
| 6 | =A4.isect() |
A4: Respectively get codes of countries where the English-speaking population exceeds 0.3%, where French-speaking population is over 0.2% and where Spanish-speaking population takes up over 0.1% and return each as a sequence.
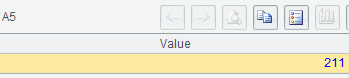
A6: Calculate intersection of A4’s sequences.
4. Retrieve data by sequence numbers of records
Example 1 : Get transaction information on the 3rd day and the third-to-last day in 2017 for stock 600036.
MySQL8:
with t as (select *, row_number() over(order by tdate) rn from stktrade where sid=‘600036’ and tdate between ‘2017-01-01’ and ‘2017-12-31’)
select tdate,open,close,volume from t where rn=3
union all
select tdate,open,close,volume from t where rn=(select max(rn)-2 from t);
SPL script:
| A | |
|---|---|
| 1 | =connect(“mysql”) |
| 2 | =A1.query@x(“select * from stktrade where sid=’600036’and tdate between’2017-01-01’and ’2017-12-31’order by tdate”) |
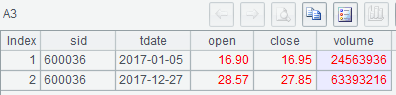
| 3 | =A2(3)|A2.m(-3) |
A3: Concatenate the 3rd record and the third-to-last record.
Example 2 : Calculate average closing price in the past 20 days for stock 600036.
MySQL8:
with t as (select *, row_number() over(order by tdate desc) rn from stktrade where sid=‘600036’)
select avg(close) avg20 from t where rn<=20;
SPL script:
| A | |
|---|---|
| 1 | =connect(“mysql”) |
| 2 | =A1.query@x(“select * from stktrade where sid=’600036’order by tdate”) |
| 3 | =A2.m(-20:) |
| 4 | =A3.avg(close) |
A2: Sort transaction records of stock 600036 by transaction dates.
A3: Get records from the 20th-to-last to the last.
A4: Calculate average closing price over A3’s records.
5. Find sequence number of records meeting the specified condition
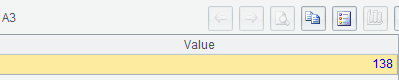
Example 1 : Find how many days stock 600036 uses to reach the closing price of 25 CNY.
MySQL8:
with t as (select *, row_number() over(order by tdate) rn from stktrade where sid=‘600036’ and tdate between ‘2017-01-01’ and ‘2017-12-31’)
select min(rn) from t where close>=25;
SPL script:
| A | |
|---|---|
| 1 | =connect(“mysql”) |
| 2 | =A1.query@x(“select * from stktrade where sid=’600036’and tdate between’2017-01-01’and ’2017-12-31’order by tdate”) |
| 3 | =A2.pselect(close>=25) |
A3: Find the position of the record where the closing price reaches 25 CNY for the first time from back to front.
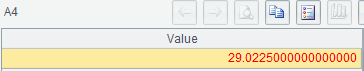
Example 2 : Calculate the growth rate in 2017 for stock 000651 (Take delisting into consideration).
MySQL8:
with t as (select * from stktrade where sid=‘000651’),
t1(d) as (select max(tdate) from t where tdate<‘2017-01-01’),
t2(d) as (select max(tdate) from t where tdate<‘2018-01-01’)
select s2.close/s1.close-1 rise
from (select * from t,t1 where tdate=d) s1,
(select * from t,t2 where tdate=d) s2;
SPL script:
| A | |
|---|---|
| 1 | =connect(“mysql”) |
| 2 | =A1.query@x("select * from stktrade where sid=’000651’and tdate<’2018-01-01’order by tdate ") |
| 3 | =A2.pselect@z(tdate < date(“2017-01-01”)) |
| 4 | =A2(A3).close |
| 5 | =A2.m(-1).close |
| 6 | =A5/A4-1 |
A2: Sort records by transaction dates in ascending order.
A3: Find the sequence number of the record on the last transaction date before 2017-01-01 from back to front.
A4: Calculate the last closing price in 2016.
A5: Calculate the last closing price in 2017. A2.m(-1) gets the last record, that is, the record on the last transaction date in 2017.
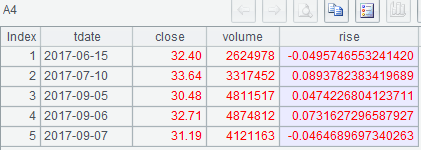
Example 3 : Get transaction records where the volume is greater than 25 million in 2017 and their daily growth rate for stock 300469 (Take delisting into consideration).
MySQL8:
with t as (select *, row_number() over(order by tdate) rn
from stktrade where sid=‘300469’ and tdate<=date ‘2017-12-31’),
t1 as (select * from t where tdate>=date’2017-01-01’ and volume>=2500000)
select t1.tdate, t1.close, t.volume, t1.close/t.close-1 rise
from t1 join t on t1.rn=t.rn+1;
SPL script:
| A | |
|---|---|
| 1 | =connect(“mysql”) |
| 2 | =A1.query@x(“select * from stktrade where sid=’300469’and tdate<= date’2017-12-31’order by tdate”) |
| 3 | =A2.pselect@a(tdate>=date(“2017-01-01”) && volume>2500000) |
| 4 | =A3.new(A2().tdate:tdate, A2().close:close, A2().volume:volume, A2().close/A2(~-1).close-1:rise) |
A3: Find sequence numbers of records where the transaction volume is greater than 25 million in 2017.
A4: Calculate date, closing price, transaction volume and growth rate according to sequence numbers.
6. Get sequence number of the record holding the max/min value
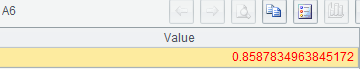
Example 1 : Find how many transaction dates between the first lowest price and the first highest price in 2017 for stock 600036.
MySQL8:
with t as (select *, row_number() over(order by tdate) rn from stktrade where sid=‘600036’ and tdate between ‘2017-01-01’ and ‘2017-12-31’),
t1 as (select * from t where close=(select min(close) from t)),
t2 as (select * from t where close=(select max(close) from t))
select abs(cast(min(t1.rn) as signed)-cast(min(t2.rn) as signed)) inteval
from t1,t2;
SPL script:
| A | |
|---|---|
| 1 | =connect(“mysql”) |
| 2 | =A1.query@x(“select * from stktrade where sid=’600036’and tdate between’2017-01-01’and ’2017-12-31’order by tdate”) |
| 3 | =A2.pmax(close) |
| 4 | =A2.pmin(close) |
| 5 | =abs(A3-A4) |
A3: Find the sequence number of the highest closing price from front to back.
A4: Find the sequence number of the lowest closing price from front to back.
Example 2 : Find how many days between the last lowest closing price and the last highest closing prices in 2017 for stock 600036.
MySQL8:
with t as (select *, row_number() over(order by tdate) rn from stktrade where sid=‘600036’ and tdate between ‘2017-01-01’ and ‘2017-12-31’),
t1 as (select * from t where close=(select min(close) from t)),
t2 as (select * from t where close=(select max(close) from t))
select abs(cast(max(t1.rn) as signed)-cast(max(t2.rn) as signed)) inteval
from t1,t2;
SPL script:
| A | |
|---|---|
| 1 | =connect(“mysql”) |
| 2 | =A1.query@x(“select * from stktrade where sid=’600036’and tdate between’2017-01-01’and ’2017-12-31’order by tdate”) |
| 3 | =A2.pmax@z(close) |
| 4 | =A2.pmin@z(close) |
| 5 | =abs(A3-A4) |
A3: Find the sequence number of the highest closing price from back to front.
A4: Find the sequence number of the lowest closing price from back to front.
7. Alignment between ordered sets
Example 1 : Calculate daily relative return of stock 399006 contrasted to stock 399001 between Mar. 3 -6, 2018.
MySQL8:
with t1 as (select *,close/lag(close) over(order by tdate) rise from stktrade where sid=‘399006’ and tdate between ‘2018-03-05’ and ‘2018-03-08’),
t2 as (select *, close/lag(close) over(order by tdate) rise from stktrade where sid=‘399001’ and tdate between ‘2018-03-05’ and ‘2018-03-08’)
select t1.rise-t2.rise
from t1 join t2 using(tdate)
where t1.rise is not null;
SPL script:
| A | |
|---|---|
| 1 | =connect(“mysql”) |
| 2 | =[“399006”,“399001”].(A1.query(“select * from stktrade where sid=? and tdate between’2018-03-05’and ‘2018-03-08’”,~)) |
| 3 | >A1.close() |
| 4 | =A2.(~.calc(to(2,4),close/close[-1])) |
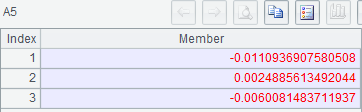
| 5 | =A4(1)–A4(2) |
A2: Get transaction records between Mar. 6 -8, 2018 for stock 399006 and stock 399001.
A4: Calculate daily growth rate from the 2nd record to the 4th record in A2’s two table sequences respectively, that is, the daily growth rate in Mar. 6 -8, 2018 for stock 399006 and stock 399001.
A5: Perform alignment subtraction to get the daily relative return.
SPL Official Website 👉 http://www.scudata.com
SPL Feedback and Help 👉 https://www.reddit.com/r/esProc
SPL Learning Material 👉 http://c.scudata.com
SPL Source Code and Package 👉 https://github.com/SPLWare/esProc
Discord 👉 https://discord.gg/ydhVnFH9
Youtube 👉 https://www.youtube.com/@esProc_SPL


Chinese version