

SPL grouping
In data calculation, grouping is absolutely one of the most commonly used calculation methods. Correspondingly, in SQL language, group by is naturally used. However, I don't know if you have thought about this: Group by in SQL can't be regarded as "pure" grouping. In fact, it's not aimed at grouping the original data, but grouping the result set. Finally, it's to realize five types of aggregate calculation: min / max / AVG / count / sum. Using group by alone doesn't make any sense. It's just equivalent to sorting according to the conditions of group by.
However, in the actual data calculation, the statistical requirements for grouped data may far exceed the ability of five types of aggregate calculation. In other words, the "real" grouping operation is performed on the original records, and the records are divided into multiple subsets. Such grouping method is not only more natural, but also convenient to perform some more complex grouping statistics. This kind of natural and pure thinking has been truly reflected in esProc. Next, we will further illustrate the real advantages of this idea by grouping aggregation, grouping subset, and enumeration grouping.
1. Grouping aggregation
First, let's take a look at the grouping calculation with SQL, which is actually the various aggregate calculation of groups. There are many methods and tools for viewing SQL execution results. Here we use esProc to directly call SQL to execute queries through JDBC:
A |
|
1 |
=demo.query(“select * from CITIES”) |
2 |
=demo.query(“select STATEID,count(*) CITY_COUNT, sum(POPULATION) POPU_AMOUNT from CITIES group by STATEID order by STATEID”) |
3 |
=demo.query(“select left(NAME,1) INITIAL, avg(POPULATION) AVG_POPU, max(POPULATION) MAX_POPU, min(POPULATION) MIN_POPU from cities group by INITIAL order by INITIAL”) |
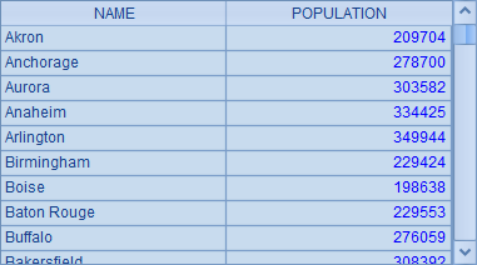
The population data of some cities are stored in the cities table. All contents of cities are queried in A1, and the results are as follows:

The group by clause of SQL can cooperate with various aggregation functions to complete the calculation. Here, the SQL in A2 is grouped according to the stateid of these cities, and the total number and population of cities in each state are calculated by count and sum functions respectively, and sorted by state ID. The query results are as follows:

The SQL in A3 is grouped according to the initial of the city name, and calculates the average population of the city with the same initial, as well as the maximum and minimum population. At the same time, the results are sorted according to the initial. The results are as follows:

From these two examples, it can be seen intuitively that when "grouping" is performed in SQL, the result is not "group", only "group calculation result", let alone each record in the group.
In esProc, we can use the groups function to realize the statistical calculation equivalent to the above SQL:
A |
|
1 |
=demo.query(“select * from CITIES”) |
2 |
=A1.groups(STATEID;count(~):CITY_COUNT, sum(POPULATION):POPU_AMOUNT) |
3 |
=A1.groups(left(NAME,1):INITIAL;avg(POPULATION):AVG_POPU, max(POPULATION):MAX_POPU, min(POPULATION):MIN_POPU) |
Take out all data in cities table in A1:
Group statistics are calculated in A2 and A3. The data obtained in A1 can be used directly during statistics, and there is no need to access the database. The result of grouping and aggregation in A2 is the same as that of using SQL:

There are some differences between the group aggregation results in A3 and the previous results. Because the double precision processing will be used by default when calculating the average value in esProc, and the integer part will be retained when calculating the integer mean value in SQL:

In addition to groups being able to directly group and aggregate like SQL, the group function can also be used to "only" group records in esProc, and then on the basis of grouping results, further aggregate calculation can be carried out, such as:
A |
|
1 |
=demo.query(“select * from CITIES”) |
2 |
=A1.group(STATEID) |
3 |
=A2.new(STATEID,~.count():CITY_COUNT, ~.sum(POPULATION):POPU_AMOUNT) |
4 |
=A1.group(left(NAME,1)) |
5 |
=A4.new(left(NAME,1):INITIAL,int(~.avg(POPULATION)):AVG_POPU, ~.max(POPULATION):MAX_POPU, ~.min(POPULATION):MIN_POPU) |
A2 divides the data into groups according to stateid, and the results are as follows:

When displaying data, you can double-click each group to view. You can find that each group is composed of one or more records. For example, there are two cities with stateid 1: Birmingham and Montgomery.
In A3, further query is made according to the grouping result, and the total number and population of cities in each state are calculated. The syntax here is different from SQL. For example, the total number of records in a group is written as ~.count(). The calculation result in A3 is as follows:

The result here is the same as the previous case with SQL and groups function. Compared with the two methods, the process is more intuitive and easier to control, and the efficiency of direct aggregation is higher.
Similar to A2, data is grouped according to the initial of the city name in A4, and the result is as follows:

In A5, the average value and the maximum and minimum value of the population in each initial group are calculated according to the grouping results.
When using the method of grouping before aggregation, the statistical method is relatively free and not limited to various aggregation functions. For example, when calculating the population average value, the int function can be used to retain the integer part of the average value, and the result is the same as that of SQL:

If you do not need to view the intermediate grouping results, you can use another writing method of group function to calculate the results directly:
A |
|
1 |
=demo.query(“select * from CITIES”) |
2 |
=A1.group(STATEID;~.count():CITY_COUNT, ~.sum(POPULATION):POPU_AMOUNT) |
3 |
=A1.group(left(NAME,1):INITIAL;int(~.avg(POPULATION)):AVG_POPU, ~.max(POPULATION):MAX_POPU, ~.min(POPULATION):MIN_POPU) |
Here, the calculation performed by A2 is actually the same as that in A2 and B2 in the previous example. A3 is equivalent to the calculation of A3 and B3 in the previous example, and the result is the same as B3. The result of this method is the same as that of the previous use of groups, but the syntax is slightly different, the statistical calculation can be completed more freely, but the calculation efficiency will be slightly lower than that of groups.
2. Grouping subset
In addition to the grouping and aggregate results, SQL grouping can only query the fields and aggregation results used in grouping, which is actually related to the data of each group during grouping. For example, the following is the city starting with B when grouping by city initial:

In such a grouping, except for the city name initial used in grouping, all other fields of each city record are from multiple records, which are not necessarily the same. Therefore, when using SQL query, only two types of fields are allowed in the result set: one is the field contained in the grouping condition, and the other is the aggregate result field such as count, sum, mean, maximum and minimum. Because of this pattern, if you want to further obtain a record in the group, or a subset of some records, it will become very complex, such as "city name with the largest population in the group", "city names with the population below the average in the group". If you still use SQL, you can only use sub query to process:
A |
|
1 |
=demo.query(“select NAME, POPULATION from CITIES c where POPULATION=(select max(POPULATION) from CITIES where left(NAME,1)=left(c.NAME,1)) order by NAME”) |
2 |
=demo.query(“select NAME, POPULATION from CITIES c where POPULATION<(select avg(POPULATION) from CITIES where left(NAME,1)=left(c.NAME,1)) order by left(NAME,1)”) |
The SQL statements in A1 and A2 use subqueries in where conditions. In A1, the name and population of the city with the largest population in each city initial groups are calculated; in A2, in each group of cities with the same initial, the name and population of the city with population lower than the average population is calculated. The results in A1 and A2 are as follows:

The SQL statements in A1 and A2 are quite lengthy and hard to read. What's more, such a processing method requires the database to perform a calculation similar to group aggregation when querying each record. The calculation efficiency is very low. Once the data volume is large, it will be a disaster. In addition, the result set returned by SQL does not actually look like the result of grouping, but lists the city data that meets the conditions in turn.
It's different in esProc. By using intuitive records grouping, the problem can be solved very simply:
A |
|
1 |
=demo.query(“select * from CITIES”) |
2 |
=A1.group(left(NAME,1)) |
3 |
=A2.(~.maxp(POPULATION)) |
4 |
=A3.new(NAME,POPULATION) |
5 |
=A2.((avg=~.avg(POPULATION),~.select(POPULATION>avg))) |
6 |
=A5.conj().new(NAME,POPULATION) |
In A2, the data is grouped according to the initial of the city name. The above two problems can be calculated by using the grouping results of A2. In A3, the city records with the largest population in each initial city group can be easily obtained. The results are as follows:

Here is the record in the original table. If you only need name and population, you can use the method in A4 to calculate the result:

This result is the same as that obtained with SQL, but the calculation process is much simpler.
The method in A5 is similar. The record of population below average in each city group with the same initial is calculated. In order to avoid repeated calculation, the average population is calculated as AVG in each group first. The results in A5 are as follows:

If you need to get the same result as SQL query, you can merge the records in each group and take out the required fields, such as the result in A6:

3. Enumeration grouping
The above mentioned grouping is actually "equivalent grouping", that is, grouping records according to the same field values or calculation results. There is also a more troubling case of "grouping by condition.".
Here, let's take an example of"grouping by enumeration conditions". We still use the previous city information data. Now we need to calculate the number of cities with the initial letters of G, R, O, U and P respectively, and the average population of these cities. If you still use SQL to execute queries, you can only use union to write an extra long statement to process it, as follows:
A |
|
1 |
=demo.query(“select 1 LOC, left(NAME,1) INITIAL, count(*) CITY_COUNT, round(avg(POPULATION),2)AVG_POPU from CITIES where left(NAME,1)=’G’ group by INITIAL union select 2 LOC, left(NAME,1) INITIAL, count(*) CITY_COUNT, round(avg(POPULATION),2)AVG_POPU from CITIES where left(NAME,1)=’R’ group by INITIAL union select 3 LOC, left(NAME,1) INITIAL, count(*) CITY_COUNT, round(avg(POPULATION),2)AVG_POPU from CITIES where left(NAME,1)=’O’ group by INITIAL union select 4 LOC, left(NAME,1) INITIAL, count(*) CITY_COUNT, round(avg(POPULATION),2)AVG_POPU from CITIES where left(NAME,1)=’U’ group by INITIAL union select 5 LOC, left(NAME,1) INITIAL, count(*) CITY_COUNT, round(avg(POPULATION),2)AVG_POPU from CITIES where left(NAME,1)=’P’ group by INITIAL order by LOC”) |
For the SQL called here, 5 similar select statements need to be union together. At the same time, in order to get the required order, a column needs to be added for sorting. The results after execution are as follows:

This situation often occurs when using SQL to process some unconventional queries. Each time, you have to write a long string of SQL. In case of any error in copying and pasting, it is quite difficult to correct it.
Because esProc is different from SQL and supports real grouping operations, this kind of personalized problem is what esProc is good at:
A |
|
1 |
=demo.query(“select * from CITIES”) |
2 |
[G,R,O,U,P] |
3 |
=A1.align@a(A2,left(NAME,1)) |
4 |
=A3.new(A2(#):INITIAL,~.count():CITY_COUNT, int(~.avg(POPULATION)):AVG_POPU) |
In A3, use the align function to align and group the city records according to the required initial. The results are as follows:

The total number of cities and average population in each group are calculated in A4. Considering the possible empty groups, the initial is directly obtained from A2 by location:

If you don't need a"U"group that doesn't contain any cities, you can change the expression in A4 to: =A3.select(~.count() > 0).new(left(NAME, 1):INITIAL, ~.count():CITY_COUNT, int(~.avg(POPULATION)):AVG_POPU).
In the above problem, grouping according to different initials, it can also be written as conditions expressed by expressions. In esProc enum function can be used to group and calculate:
A |
|
1 |
=demo.query(“select * from CITIES”) |
2 |
[left(?,1)==”G”,left(?,1)==”R”,left(?,1)==”O”,left(?,1)==”U”,left(?,1)==”P”] |
3 |
=A1.enum(A2,NAME) |
4 |
=A3.new(A2(#):INITIAL,.count():CITY_COUNT, int(.avg(POPULATION)):AVG_POPU) |
The grouping conditions in A2 are expressed in a more intuitive way, for example, left(?, 1) == "G" means the initial is G, and so on. In this case, enum function can be used to group by conditions based on the initial of name. The grouping results in A3 and the aggregation results in A4 are the same as those in align.
In fact, when align is used to align groups, the solution is still "equivalent grouping", while when enumerating groups, it is very free, as long as the conditions can be expressed by expressions can be used as the basis for grouping. For example, cities are grouped by population as follows:
A |
|
1 |
=demo.query(“select * from CITIES”) |
2 |
[?>5000000, ?>2000000, ?>1000000] |
3 |
=A1.enum(A2,POPULATION) |
4 |
=A3.new(A2(#):POPU_SCALE,~.count():CITY_COUNT, int(~.avg(POPULATION)):AVG_POPU) |
In A3, cities are divided into three groups according to population: over 5 million, over 2 million and over 1 million. The results are as follows:

In A4, the statistical calculation is based on the grouping results:
When enumerating and grouping with enum function, multiple grouping modes are also supported, such as:
A |
|
1 |
=demo.query(“select * from CITIES”) |
2 |
[?>5000000, ?>2000000, ?>1000000] |
3 |
=A1.enum@r(A2,POPULATION) |
4 |
=A1.enum@n(A2,POPULATION) |
When enumerating groups in A3, the @r option is added. In this case, records are allowed to appear in different groups repeatedly. The grouping results are as follows:

From the results, it can be seen that since cities with a population of more than 5 million can meet the demand of a population of more than 2 million, New York in group 1 is also included in group 2 under this grouping mode.
The @n option is used in A4, and the grouping results are as follows:

It can be found that at this time, there is an additional group at the end of grouping. City records that do not meet any of the grouping conditions in A2 are all divided into group 4.
When enumerative grouping is used in esProc, it can deal with all kinds of flexible group computing problems, which is often the biggest trouble when using SQL. So, it's time to get rid of the long and annoying SQL statements. Let esProc help you relax.
SPL Official Website 👉 http://www.scudata.com
SPL Feedback and Help 👉 https://www.reddit.com/r/esProc
SPL Learning Material 👉 http://c.scudata.com
SPL Source Code and Package 👉 https://github.com/SPLWare/esProc
Discord 👉 https://discord.gg/ydhVnFH9
Youtube 👉 https://www.youtube.com/@esProc_SPL


Chinese version