

Excel Grouping & Aggregation Examples
I Common full division
The following 2019 product sales table records sales details of a product for every salesperson. The task is to list the top three salespeople in terms of sales amount.
Below is the Excel data:

The expected result:

Excel data table is useful in handling this task but it is difficult to use. It is useful because the feature can manage to get the aggregates, sort them, find the top three salespeople, and copy the relevant records as the desired result. But it’s inconvenient to handle all operations manually when the original data size is large or the number of to-be-calculated ranks is many.
SPL, however, handles the task in a stepwise way by conforming to the intuitive line of thinking:
A |
B |
|
1 |
=clipboard().import@t() |
/ Import the sales data with column headers from the clipboard |
2 |
=A1.groups(Sale;sum(Amount):Total) |
/ Group data by salespeople and sum the amount for each of them |
3 |
=A2.top(-3;Total) |
/ Get the records where the total amount ranks top three |
4 |
=A3.derive(#:Rank) |
/ Add a new column named Rank |
5 |
=clipboard(A4.export@t()) |
/ Paste the aggregation result to the clipboard |
After the script is executed, you just need to paste the result to Excel to get the expected table.
A SPL script interacts with Excel through the clipboard. It copies & pastes the to-be-analyzed data to the clipboard, edits the script in esProc designer and executes it, and then pastes the result to Excel.
II Grouping with “other records” combined
Sometimes it’s a part of the original detailed data that we are concerned with, and we just summarize all the other data. Based on Excel data in the previous example, we want to calculate the total sales of each kind of fruits and summarize the sales quantities of all vegetables.
The expected result:

The grouping basis is too specific to be handled using the pivot table. You have to write a macro with VBA to use the program to group data according to specific values. It’s complicated and difficult.
SPL handles such type of grouping using enumerated values:
A |
B |
|
1 |
=clipboard().import@t() |
/ Import sales records from clipboard |
2 |
=A1.align@an(["Orange","Grape","Apple","Banana","Strawberry"],Product) |
/ Group records by the fruit list and use @n option to put records of other products into same group |
3 |
=A2.new(Product,~.sum(Amount):Total) |
/ Calculate the total sales amount in each group and create a new table sequence |
4 |
=A3(A3.len()).Product="Others" |
/ Rename the last column Product Others |
5 |
=clipboard(A3.export@t()) |
/ Export the result set and paste it to clipboard |
Then past the clipboard content to Excel to get the desired result.
III Alignment grouping by supplying missing values
Pivot tables will not create groups for values that are missing in the grouping basis. When we group the sales table where there are no sales records for some months by date using pivot tables, we get the following result:
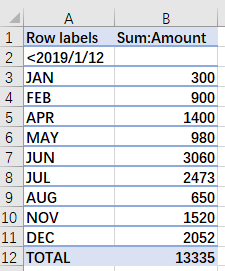
Since certain months don’t have corresponding data, there are no groups for them. The result is not regular. But what we want is this:

Pivot tables are not able to achieve this. And it’s also hard to do this in VBA.
SPL handles this type of by defining a grouping basis:
A |
B |
|
1 |
=clipboard().import@t() |
/ Import sales records from clipboard |
2 |
=A1.run(Date=date(Date,"yyyy/MM/dd")) |
/ Convert string type Date field values into date type |
3 |
=A2.align@a(12,month(Date)) |
/ Group Date values by the 12 months |
4 |
=A3.new(#:Month,~.sum(Amount):Total) |
/ Sum sales amounts in each group and create a new table sequence |
5 |
=clipboard(A4.export@t()) |
/ Export the result set and paste it to clipboard |
IV Grouping by intervals
Below is the student score table. The grading scale is like this:≤60 is a C, >60 & < 90 is a B, and ≥90 is an A. The task is to count the students in each level.

The expected result:

After you define the score intervals, you can use pseg function to divide the student scores and then you perform count on each group.
SPL script:
A |
B |
|
1 |
=clipboard().import@t() |
/ Import the scores table from clipboad |
2 |
=[0,60,90] |
/ Define intervals of scores |
3 |
=["C","B","A"] |
/ Define a name for each interval |
4 |
=A1.align@a(A2.len(),A2.pseg(Score)) |
/ Get the interval for each score and group scores by intervals |
5 |
=A4.new(A3(#):Level,~.count():Count) |
/ Count students in each interval and create a new table sequence |
6 |
=clipboard(A5.export@t()) |
/ Export the result set and paste it to clipboard |
V Grouping by overlapping conditions
The following table lists the GDP of some countries in 2019. The task is to calculate the average GDP for developed countries, developing countries, and the BRICS countries.
2019 GDP figures of some countries (Unit: $billion):

The expected result:

The developing countries and BRICS countries share common values. To handle grouping tasks with overlapping conditions, SPL offers enum function to define enumerated conditions in a flexible way.
SPL script:
A |
B |
|
1 |
=clipboard().import@t() |
/ Import the GDP table from clipboard |
2 |
["America","Japan","Germany","Britain","France","Italy","Canada","Korea","Australia"].pos(?)>0 |
/ Enumerate the developed countries |
3 |
["China","India","Mexico","SouthAfrica"].pos(?)>0 |
/ Enumerate the developing countries |
4 |
["Brazil","Russia","India","China","South Africa"].pos(?)>0 |
/ Enumerate the BRICS countries |
5 |
=[A2:A4] |
/ Define a sequence of enumerated conditions |
6 |
=["Developed","Developing","BRICS"] |
/ Define a name for each condition |
7 |
=A1.enum@r(A5,Country) |
/ Use @r option with enum function to group countries; this allows putting one country in different groups |
8 |
=A7.new(A6(#):Countries,~.avg(GDP):Average) |
/ Calculate average GDP for each group and create a new table sequence |
9 |
=clipboard(A8.export@t()) |
/ Export the result set and paste it to clipboard |
Find more examples agile computing in SPL Cookbook.
SPL Official Website 👉 http://www.scudata.com
SPL Feedback and Help 👉 https://www.reddit.com/r/esProc
SPL Learning Material 👉 http://c.scudata.com
SPL Source Code and Package 👉 https://github.com/SPLWare/esProc
Discord 👉 https://discord.gg/ydhVnFH9
Youtube 👉 https://www.youtube.com/@esProc_SPL


Chinese version