How to List Empty Groups during Group-based Transposition on Excel Data
Task description
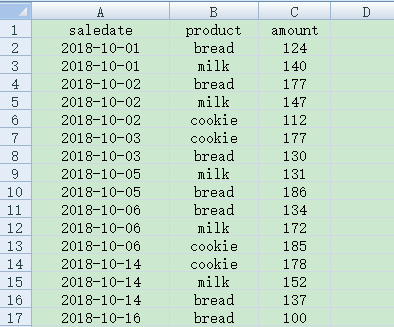
sales.xlsx stores daily sales records for different types of products. There are no records in certain dates. Below is part of the source data:

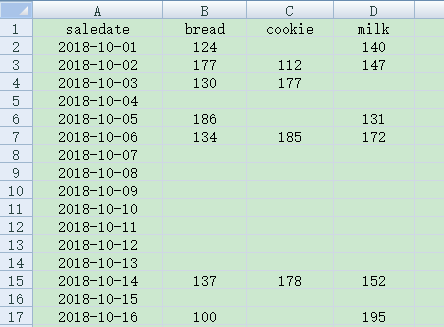
1. The first task is to generate a crosstab where the row headers are dates and the column heads are products and where dates without sales records are listed, as shown below:

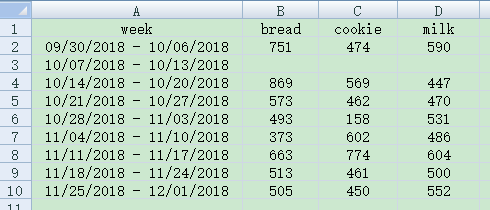
2. The second task is to generate a crosstab where the row headers are weeks and the column heads are products and where weeks without sales records are listed, as shown below:

Directions:
1. Start esProc
Download esProc installation package and free DSK edition license HERE. You will be prompted to load the license file when you run esProc for the first time
2. Write script in esProc:
(1) By dates

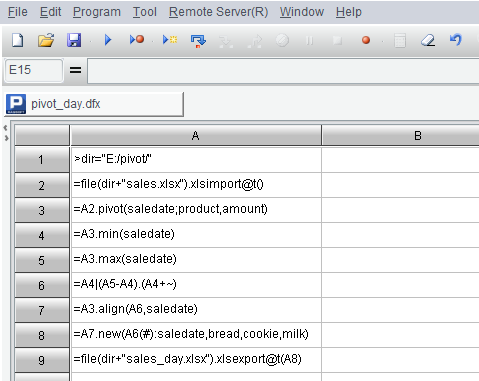
Here’s the esProc code:
| A |
|
| 1 |
>dir="E:/pivot/" |
| 2 |
=file(dir+"sales.xlsx").xlsimport@t() |
| 3 |
=A2.pivot(saledate;product,amount) |
| 4 |
=A3.min(saledate) |
| 5 |
=A3.max(saledate) |
| 6 |
=A4|(A5-A4).(A4+~) |
| 7 |
=A3.align(A6,saledate) |
| 8 |
=A7.new(A6(#):saledate,bread,cookie,milk) |
| 9 |
=file(dir+"sales_day.xlsx").xlsexport@t(A8) |
A1 Define a directory for storing the result Excel file.
A2 Import sales.xlsx; @t enables importing the first row as column headers.
A3 Perform transposition on A2 according to specific grouping columns, where salesdates are row headers, products are column headers and amount is the categorical data.
A4 Get the earliest date in A3.
A5 Get the most recent date in A3.
A6 Union all dates in A4 and A5 to generate a sequence of dates in ascending order.
A7 Align saledates of A3 to A6’s sequence of dates.
A8 Use new() function to redefine each row of A7. The number sign # represents the current row number. Get the salesdate of the corresponding row in A6, and then get the bread, cookie and milk values in the current row of A7.
A9 Store A8’s result in Excel file sales_day.xlsx.
(2) By weeks
Here’s the esProc code:
| A |
|
| 1 |
>dir="E:/pivot/" |
| 2 |
=file(dir+"sales.xlsx").xlsimport@t() |
| 3 |
=A2.pivot@s(pdate@w(saledate):Sunday;product,sum(amount)) |
| 4 |
=A3.min(Sunday) |
| 5 |
=A3.max(Sunday) |
| 6 |
=A4|((A5-A4)\7).(A4+~*7) |
| 7 |
=A3.align(A6,Sunday) |
| 8 |
=A7.new(string(A6(#),"MM/dd/yyyy")/" -"/string(A6(#)+6,"MM/dd/yyyy"):week,bread,cookie,milk) |
| 9 |
=file(dir+"sales_week.xlsx").xlsexport@t(A8) |
A1 Define a directory for storing the result Excel file.
A2 Import sales.xlsx; @t enables importing the first row as column headers.
A3 Perform grouping & transposition on A2 by the Sunday date of the week where a salesdate belongs to and name it Sunday. Products are column headers and the sum of amounts in the current week is the categorical data. pdate@w(saledate) gets the date of Sunday of the week the current salesdate falls in.
A4 Get the earliest Sunday date in A3.
A5 Get the most recent Sunday date in A3.
A6 Union all Sunday dates in A4 and A5 to generate a sequence of Sunday dates in ascending order.
A7 Align Sundays of A3 to A6’s sequence.
A8 Use new() function to redefine each row of A7. The number sign # represents the current row number. Get the Sunday date of the corresponding row in A6, convert it to a string of corresponding format, join the string to the Saturday date 6 day later, convert the result to string of corresponding format, and then get the bread, cookie and milk values in the current row of A7.
A9 Store A8’s result in Excel file sales_day.xlsx.
3. Press F9 to execute the above scripts. Then you can view the result files under E:/pivot directory, which are the same as expected.
【 Reference 】 pivot.zip
SPL Official Website 👉 http://www.scudata.com
SPL Feedback and Help 👉 https://www.reddit.com/r/esProc_Desktop/
SPL Learning Material 👉 http://c.scudata.com
Discord 👉 https://discord.gg/ydhVnFH9
Youtube 👉 https://www.youtube.com/@esProcDesktop
Linkedin Group 👉 https://www.linkedin.com/groups/14419406/


