

SPL general table operations
1. Filter
Filter out the records that meet the conditions from the data table.
Example: Filter the student scores of class 10 from the student score table Students_scores.txt. The first row of the file is the column name, and the second row is the data, as shown in the figure below.

A |
|
1 |
=T(“E:/txt/Students_scores.txt”).select(CLASS==10) |
A1 reads the data in the file and then selects the data record of class 10. The T function will automatically select the appropriate separator based on the file extension.
2. Summary
Summarize the data in the data table.
Example: Calculate the average Chinese score, the highest score in mathematics, and the total score in English for all students.
A |
|
1 |
=T(“E:/txt/Students_scores.txt”) |
2 |
=A1.avg(Chinese) |
3 |
=A1.max(Math) |
4 |
=A1.sum(English) |
A1 reads the data in the file, and the T function automatically selects a suitable separator according to the file extension.
A2 Calculate the average language score.
A3 Calculate the highest score in mathematics.
A4 calculate English total score.
3. Cross-column calculation
Perform cross-column calculations in the data table.
Example: Calculate the total score of each student.
A |
|
1 |
=T(“E:/txt/Students_scores.txt”) |
2 |
=A1.derive(English+Chinese+Math:total_score) |
A1 reads the data in the file, and the T function automatically selects a suitable separator according to the file extension.
A2 adds a column total_score to A1, whose value is the sum of the three columns of English, Chinese, and Mathematics
The results in A2 are as follows:

4. Sort
Sort the data in ascending/descending order.
Example: Arrange the student transcript in ascending order of class number and descending order of total score.
A |
|
1 |
=T(“E:/txt/Students_scores.txt”) |
2 |
=A1.sort(CLASS) |
3 |
=A1.sort(CLASS,-Math) |
A1 reads the data in the file, and the T function automatically selects a suitable separator according to the file extension.
A2 sorted by class number in ascending order.
A3 is first arranged in ascending order of class number and then in descending order of mathematics results.
5. Group summary
Group and summarize the data in the data table.
Example: Query the lowest score in English, highest score in Chinese, and total score in mathematics for each class.
A |
|
1 |
=T(“E:/txt/Students_scores.txt”) |
2 |
=A1.groups(CLASS;min(English),max(Chinese),sum(Math)) |
A1 reads the data in the file, and the T function automatically selects a suitable separator according to the file extension.
A2 A1 is grouped by class to calculate the lowest score in English, the highest score in Chinese, and the total score in mathematics for each class.
6. Filter after grouping
Group and summarize the data in the data table before filtering.
Example: Find classes with an average score of less than 70 in English.
A |
|
1 |
=T(“E:/txt/Students_scores.txt”) |
2 |
=A1.groups(CLASS;avg(English):avg_En) |
3 |
=A2.select(avg_En<70) |
A1 reads the data in the file, and the T function automatically selects a suitable separator according to the file extension.
A2 Group A1 by class, calculate the average English score of each class and name the new column named avg_En.
A3 selects from A2 those with an average English score of less than 70
The query results in A3 are as follows:

7. Association
7.1 Associative calculation
Perform correlation calculations on the data in the two data tables.
Example: The sales order information and product information are stored in two Excel files, respectively, and the sales amount of each order is calculated. The data structure of the two files is as follows:

A |
|
1 |
=T(“e:/orders/sales.xlsx”) |
2 |
=T(“e:/orders/product.xlsx”).keys(ID) |
3 |
=A1.join(ProductID,A2,Name,Price) |
4 |
=A3.derive(Quantity*Price:amount) |
A1 Read sales order data.
A2 Read product information data, set ID as the primary key
A3 associates A1 with the primary key in A2 according to ProductID , and at the same time takes out Name and Price column data.
A4 A3 adds a new column of amount, and its value is the sales quantity Quantity multiplied by the product price Price.
7.2 Associative query
Perform an associated query on the data in the two data tables.
Example: Still use the two files in the previous section to query sales orders with product prices greater than 20 yuan.
A |
|
1 |
=T(“e:/orders/sales.xlsx”) |
2 |
=T(“e:/orders/product.xlsx”).select(Price>20).keys(ID) |
3 |
=A1.switch@i(ProductID,A2) |
A1 Read sales order data.
A2 Read the product information data, select the product information with a price greater than 20, and then set the ID as the main key.
A3 according to ProductID, A1 to be associated with the primary key of A2, the option @i represents A2 is not found in the ProductID match the product ID, then this record was filtered off.
7.3 query main table and subtable
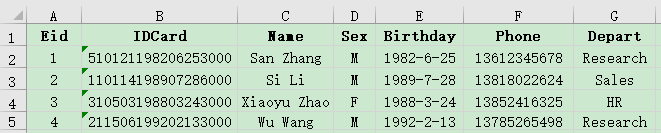
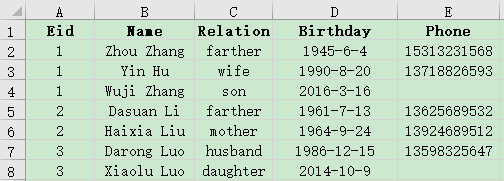
Associative query on the main table and detailed table data, Example: Some data in the employee information table employee.xlsx and employee family member table family.xlsx are as follows. Please query the information of employees who have an elderly person over 70 years old at home.
A |
|
1 |
=T("e:/work/employee.xlsx") |
2 |
=T("e:/work/family.xlsx").select(age(Birthday)>=70) |
3 |
=join(A1:employee,Eid;A2:family,Eid) |
4 |
=A3.conj(employee) |
A1 Read employee data.
A2 Read employee family member data and select members over 70.
A3 associates A1 and A2 according to Eid, deletes unmatched records, and names A1 as employee and A2 as family.
A4 takes out the employee column in A3 and joins it as a table sequence
SPL Official Website 👉 http://www.scudata.com
SPL Feedback and Help 👉 https://www.reddit.com/r/esProc_Desktop/
SPL Learning Material 👉 http://c.scudata.com
Discord 👉 https://discord.gg/ydhVnFH9
Youtube 👉 https://www.youtube.com/@esProcDesktop
Linkedin Group 👉 https://www.linkedin.com/groups/14419406/

