

Calculate Adjacent Rows with Discontinuous the-Same-Category Data
Example
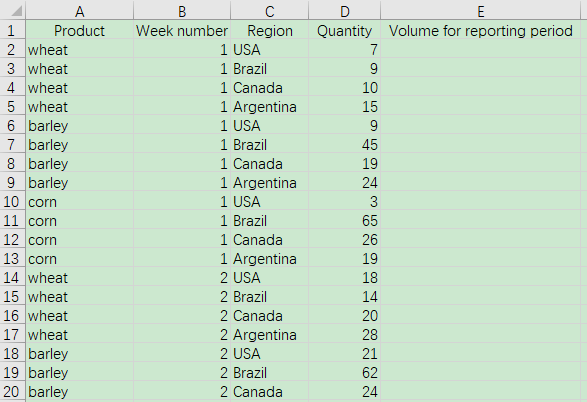
In the Excel file book1.xlsx, there is a set of import quantity tables of food crops classified by region, product, and week. The screenshot of some of the data is as follows:
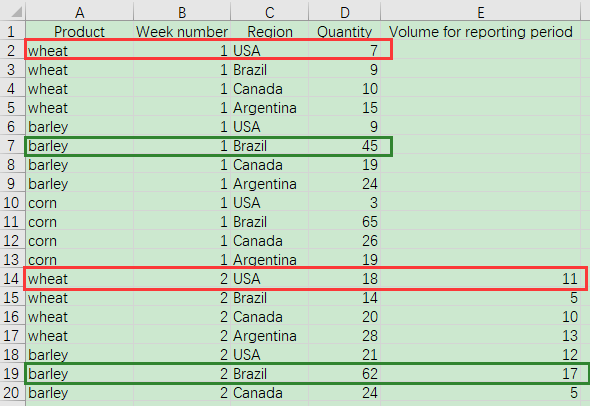
The task is to calculate the quantity increase of the same product in the same area compared to last week and put the result in column E, as shown in the figure below. The same colors show the quantity increase calculated across corresponding rows:
Write SPL script:
A |
|
1 |
=T("e:/work/book1.xlsx") |
2 |
=A1.group(Product,Region) |
3 |
=A2.run(~.run(#5=if(#>1,Quantity-Quantity[-1]))) |
4 |
=T("e:/work/book2.xlsx",A1) |
A1 Read the data of book1.xlsx
A2 Group the data by Product and Region
A3 Loop through each group and loop through each record in the group. If the sequence number # of the record in the group is greater than 1, then calculate the value in the fifth column as the Quantity of the current record minus the Quantity of the previous record.
A4 Store the result of A1 to book2.xlsx
SPL Official Website 👉 http://www.scudata.com
SPL Feedback and Help 👉 https://www.reddit.com/r/esProc
SPL Learning Material 👉 http://c.scudata.com
SPL Source Code and Package 👉 https://github.com/SPLWare/esProc
Discord 👉 https://discord.gg/ydhVnFH9
Youtube 👉 https://www.youtube.com/@esProc_SPL

