

Fiter and Summary a CSV file
Filter
Filter out the records that meet the conditions from the data table.
Example: Filter the student scores of class 10 from the student score table Students_scores.txt. The first row of the file is the column name, and the second row is the data, as shown in the figure below.
CLASS	NAME	English	  Chinese	Math
1	Adams Brooke	  63	31	69
1	Adams Hannah	  89	85	79
1	Adams Jonathan    88	87	91
1	Allen Ashley	  98	97	97
| + | A |
|---|---|
| 1 | =T(“E:/txt/Students_scores.txt”).select(CLASS==10) |
A1 reads the data in the file and then selects the data record of class 10. The T function will automatically select the appropriate separator based on the file extension.
Summary
Summarize the data in the data table.
Example: Calculate the average Chinese score, the highest score in mathematics, and the total score in English for all students.
| + | A |
|---|---|
| 1 | =T(“E:/txt/Students_scores.txt”) |
| 2 | =A1.avg(Chinese) |
| 3 | =A1.max(Math) |
| 4 | =A1.sum(English) |
A1 reads the data in the file, and the T function automatically selects a suitable separator according to the file extension.
A2 Calculate the average language score.
A3 Calculate the highest score in mathematics.
A4 calculate English total score.
Cross-column calculation
Perform cross-column calculations in the data table.
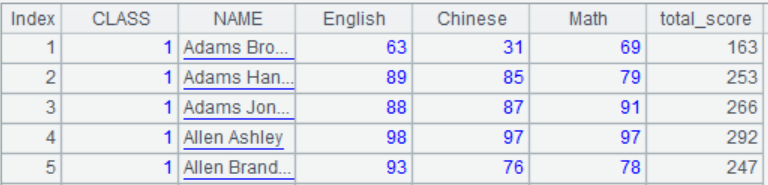
Example: Calculate the total score of each student.
| + | A |
|---|---|
| 1 | =T(“E:/txt/Students_scores.txt”) |
| 2 | =A1.derive(English+Chinese+Math:total_score) |
A1 reads the data in the file, and the T function automatically selects a suitable separator according to the file extension.
A2 adds a column total_score to A1, whose value is the sum of the three columns of English, Chinese, and Mathematics
The results in A2 are as follows:
Group summary
Group and summarize the data in the data table.
Example: Query the lowest score in English, highest score in Chinese, and total score in mathematics for each class.
| + | A |
|---|---|
| 1 | =T(“E:/txt/Students_scores.txt”) |
| 2 | =A1.groups(CLASS;min(English),max(Chinese),sum(Math)) |
A1 reads the data in the file, and the T function automatically selects a suitable separator according to the file extension.
A2 A1 is grouped by class to calculate the lowest score in English, the highest score in Chinese, and the total score in mathematics for each class.
Filter after grouping
Group and summarize the data in the data table before filtering.
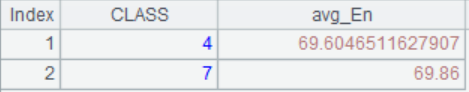
Example: Find classes with an average score of less than 70 in English.
| + | A |
|---|---|
| 1 | =T(“E:/txt/Students_scores.txt”) |
| 2 | =A1.groups(CLASS;avg(English):avg_En) |
| 3 | =A2.select(avg_En<70) |
A1 reads the data in the file, and the T function automatically selects a suitable separator according to the file extension.
A2 Group A1 by class, calculate the average English score of each class and name the new column named avg_En.
A3 selects from A2 those with an average English score of less than 70
The query results in A3 are as follows:
Know more about esProc and SPL
SPL Official Website 👉 https://www.scudata.com
SPL Feedback and Help 👉 https://www.reddit.com/r/esProc_Desktop/
SPL Learning Material 👉 https://c.scudata.com
Discord 👉 https://discord.gg/2bkGwqTj
Youtube 👉 https://www.youtube.com/@esProcDesktop
Linkedin Group 👉 https://www.linkedin.com/groups/14419406/

