

Comparison of SQL & SPL: Equi-grouping
A grouping operation puts members of same attribute in a set into same group. In an employee table grouped by department, each group of employees work in the same department. In a grouped sales table by the year, each group contains sales records of the same year. Both SQL and SPL are commonly used programming languages. In this essay, we’ll take a look at their solutions and basic principles in handling the grouping operations through sample programs, aiming to find the faster and more efficient way for you. Looking Comparison of SQL & SPL: Equi-grouping for details.
Ⅰ. Grouping & aggregation
In certain cases, we need to summarize data according to their type, so grouping & aggregation will be used. A grouping & aggregation operation divides data into groups according to a specific rule and then performs an aggregate operation on each group.
Calculate the total score of each student |
Grouping operation |
Aggregation operation |
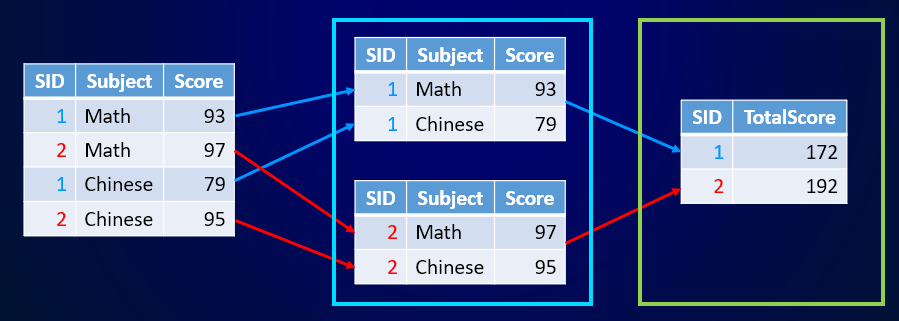
Users familiar with SQL or SPL are sure to know well about the grouping & aggregation. SQL has GROUP BY statement to do the job. It is often used with aggregate functions, such as SUM()and COUNT(), to group the result set by one or more fields and summarize data in each group. Its SPL counterpart is groups() function.
【Example 1】According to the sales data table below, calculate the total sales amount in each month of the year of 2014. Below is part of the source table:
ID |
CUSTOMERID |
ORDERDATE |
SELLERID |
PRODUCTID |
AMOUNT |
10400 |
EASTC |
2014/01/01 |
1 |
27 |
3063.0 |
10401 |
HANAR |
2014/01/01 |
1 |
17 |
3868.6 |
10402 |
ERNSH |
2014/01/02 |
8 |
70 |
2713.5 |
10403 |
ERNSH |
2014/01/03 |
4 |
42 |
1005.9 |
10404 |
MAGAA |
2014/01/03 |
2 |
74 |
1675.0 |
… |
… |
… |
… |
… |
… |
SQL solution:
select
extract (month from ORDERDATE) MONTH, sum(AMOUNT) AMOUNT
from
SALES
where
extract (year from ORDERDATE)=2014
group by
extract (month from ORDERDATE)
order by
MONTH
The GROUP BY statement in SQL groups and summarizes data according to the grouping field specified in BY statement. In a SELECT statement containing GROUP BY, the specified to-be-selected field must be the grouping field. Any other field that needs to be written in the SELECT statement should be packaged with the aggregate function, if there is any. The WHERE statement can be used to filter data before performing grouping & aggregation.
Our sample SQL code is written in Oracle. You can use YEAR function and MONTH function when using any other database.
SPL solution:
SPL offers A.groups() function to do grouping & aggregation.
A |
|
1 |
=T("Sales.csv").select(year(ORDERDATE)==2014) |
2 |
=A1.groups(month(ORDERDATE):MONTH; sum(AMOUNT):AMOUNT) |
A1:Import a sales table from the source file and select records of 2014.
A2: A.groups() function groups the selected records by month and sums sales amounts for each month.
SPL can retrieve a data table from the database, too. The above A1 can be modified as:
A |
|
1 |
=connect("db").query("select * from SALES where extract (year from ORDERDATE)=2014") |
【Example 2】Find the New York departments where the average age of employees is below 40. Below is part of the source table:
ID |
NAME |
BIRTHDAY |
STATE |
DEPT |
SALARY |
1 |
Rebecca |
1974/11/20 |
California |
R&D |
7000 |
2 |
Ashley |
1980/07/19 |
New York |
Finance |
11000 |
3 |
Rachel |
1970/12/17 |
New Mexico |
Sales |
9000 |
4 |
Emily |
1985/03/07 |
Texas |
HR |
7000 |
5 |
Ashley |
1975/05/13 |
Texas |
R&D |
16000 |
… |
… |
… |
… |
… |
… |
SQL solution:
select
DEPT, avg(TRUNC(months_between(sysdate, BIRTHDAY)/12)) AVGAGE
from
EMPLOYEE
where
STATE='New York'
group by
DEPT
having
avg(TRUNC(months_between(sysdate, BIRTHDAY)/12))<40
SQL uses WHERE statement to select the targeted data before performing grouping & aggregation and HAVING statement to select the desired result data after grouping & aggregation is executed.
SPL solution:
A |
|
1 |
=T("Employee.csv").select(STATE=="New York") |
2 |
=A1.groups(DEPT;avg(age(BIRTHDAY)):AVGAGE) |
3 |
=A2.select(AVGAGE<40) |
A1:Import employee table and select records of New York.
A2: A.groups() function groups the selected records and calculates the average of each department.
A3:Select records where the average age is below 40 from A2’s result set.
SPL uses the A.select()function to do all filtering, before or after the grouping operation. The language has age() function to calculate ages according to birth dates.
【Example 3】According to the sales table below, count the frequencies of ranking monthly top 3 in terms of single order amount for each customer in the year of 2014. Below is part of the source table:
ID |
CUSTOMERID |
ORDERDATE |
SELLERID |
PRODUCTID |
AMOUNT |
10400 |
EASTC |
2014/01/01 |
1 |
27 |
3063.0 |
10401 |
HANAR |
2014/01/01 |
1 |
17 |
3868.6 |
10402 |
ERNSH |
2014/01/02 |
8 |
70 |
2713.5 |
10403 |
ERNSH |
2014/01/03 |
4 |
42 |
1005.9 |
10404 |
MAGAA |
2014/01/03 |
2 |
74 |
1675.0 |
… |
… |
… |
… |
… |
… |
SQL solution:
select
CUSTOMERID, count(*) COUNT
from
(select
CUSTOMERID,
ROW_NUMBER()OVER(PARTITION BY extract (month from ORDERDATE) ORDER BY AMOUNT DESC) MONTH_RANK
from SALES
where extract (year from ORDERDATE)=2014)
where MONTH_RANK<=3
group by CUSTOMERID
order by CUSTOMERID
Getting ranks after grouping is a common computing requirement, but SQL GROUP BY does not support the rank function. SQL uses ROW_NUMBER,RANK or DENSE_RANK as an alternative to do the post-grouping ranking operation.
SPL solution:
A |
|
1 |
=T("Sales.csv").select(year(ORDERDATE)==2014) |
2 |
=A1.groups(month(ORDERDATE):MONTH; top(-3;AMOUNT):TOP3) |
3 |
=A2.conj(TOP3).groups(CUSTOMERID; count(~):COUNT) |
A1:Import the sales table and select records of 2014.
A2:A.groups() function groups the selected records by month and gets the top 3 in each month.
A3:Concatenate all top 3s and then use A.groups() function to count frequencies by customer.
SPL A.groups()function supports not only SQL-supported aggregate functions like sum, count, avg, max, and min but other commonly used aggregate functions, including top/bottom N, iterate, icount (distinct count), median (supported by certain databases) and etc., which are not supported by SQL GROUP BY.
【Example 4】Calculate the median and count the students who fail the exam (below 60) for each subject in every class. Below is part of the source table:
CLASS |
STUDENTID |
SUBJECT |
SCORE |
1 |
1 |
English |
84 |
1 |
1 |
Math |
77 |
1 |
1 |
PE |
69 |
1 |
2 |
English |
81 |
1 |
2 |
Math |
80 |
… |
… |
… |
… |
SQL solution:
select
t1.CLASS,t1.SUBJECT,t1.MEDIAN_SCORE,
nvl(t2.FAIL_COUNT,0) FAIL_COUNT
from
(select CLASS, SUBJECT, median(SCORE) MEDIAN_SCORE
from SCORES
group by CLASS, SUBJECT
order by CLASS, SUBJECT) t1
left join
(select CLASS, SUBJECT, count(*) FAIL_COUNT
from SCORES
where SCORE<60
group by CLASS, SUBJECT) t2
on t1.CLASS=t2.CLASS and t1.SUBJECT=t2.SUBJECT
To count students who fail the exams, SQL will first select records where scores are below 60 using WHERE statement and then use COUNT function to do the calculations. This way you cannot calculate the median and count the target students at the same time.
As we take Oracle as the example, the database has MEDIAN function to calculate the median. But certain databases do not have the counterpart function to calculation the median. With those databases, we need to do the calculation through the post-sorting row numbers.
SPL solution:
A |
|
1 |
=T("Scores.csv") |
2 |
=A1.groups(CLASS,SUBJECT; median(,SCORE):MEDIAN_SCORE, count(SCORE<60):FAIL_COUNT) |
A1:Import the scores table.
A2: A.groups() function groups A1’s table by class and subject, and calculates median and counts students who fail exams for each subject in each class.
You can use parameter “SCORE<60” directly in SPL count() function to count the students who fail exams, without having to first select the eligible records. This enables you to conveniently calculate the median and count the target students at the same time.
Ⅱ. Post-grouping subsets
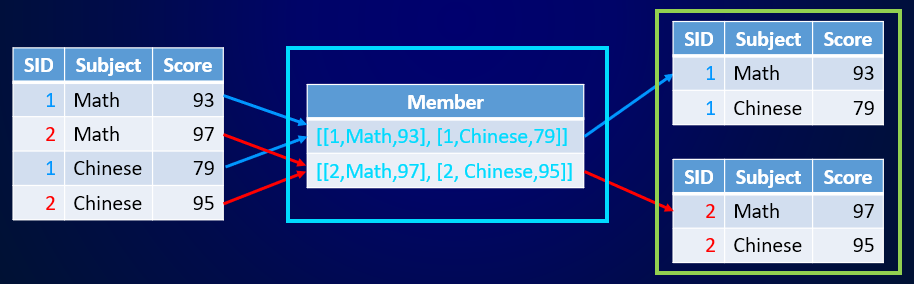
The essence of grouping operation is to split a set into multiple subsets according to a specific rule, so the operation will return a set of sets. For each member set, we call it the post-grouping subset.
Strictly speaking, grouping and aggregation are two independent actions. As SQL packs them together, we get the false impression that they are a bundle. The design reduces the scalability of grouping operation, which could have supported more aggregate functions.
SPL group() function achieves grouping operation in its true feature and returns a result set consisting of multiple post-groping subsets:
Group by student: |
Groups |
Post-grouping subsets |
Usually, it is the aggregate of subsets that we take more interests, so a grouping operation is often followed by an aggregation on subsets. Yet in certain cases, the focus is on the post-grouping subsets instead of on the aggregates.
【Example 5】According to the following employee table, find employees who were bore on the same day. Below is part of the source table:
ID |
NAME |
BIRTHDAY |
STATE |
DEPT |
SALARY |
1 |
Rebecca |
1974/11/20 |
California |
R&D |
7000 |
2 |
Ashley |
1980/07/19 |
New York |
Finance |
11000 |
3 |
Rachel |
1970/12/17 |
New Mexico |
Sales |
9000 |
4 |
Emily |
1985/03/07 |
Texas |
HR |
7000 |
5 |
Ashley |
1975/05/13 |
Texas |
R&D |
16000 |
… |
… |
… |
… |
… |
… |
SQL solution:
As SQL’s false grouping operation cannot keep the post-grouping subsets, we have to first group and count employees by birthday and select birthdays corresponding to more than one employee. Then we re-retrieve records from the employee table and perform inner join between the table and the selected birthdays. The extra query and filtering join are needed for a computing task that could have been handled with only one grouping operation. Below are the SQL queries:
select *
from EMPLOYEE t1
inner join
(select BIRTHDAY
from EMPLOYEE
group by BIRTHDAY
having count(*)>1) t2
on t1.BIRTHDAY=t2.BIRTHDAY
SPL solution:
SPL offers A.group() function to achieve true grouping operations.
A |
|
1 |
=T("Employee.csv") |
2 |
=A1.group(BIRTHDAY) |
3 |
=A2.select(~.len()>1).conj() |
A1:Import the employee table.
A2:A.group() function groups A1’s table by birthday.
A3:Select the post-grouping subsets where the number of members is more than one, that is, those having same birthdays, and then concatenate them.
The SPL script is far more succinct then a SQL one because the SPL grouping operation returns a set made up of subsets containing records of employees who were born on the same day.
【Example 6】According to the following employee table, find employees whose age are below the department average. Below is part of the source table:
ID |
NAME |
BIRTHDAY |
STATE |
DEPT |
SALARY |
1 |
Rebecca |
1974/11/20 |
California |
R&D |
7000 |
2 |
Ashley |
1980/07/19 |
New York |
Finance |
11000 |
3 |
Rachel |
1970/12/17 |
New Mexico |
Sales |
9000 |
4 |
Emily |
1985/03/07 |
Texas |
HR |
7000 |
5 |
Ashley |
1975/05/13 |
Texas |
R&D |
16000 |
… |
… |
… |
… |
… |
… |
SQL solution:
SQL grouping & aggregation only supports a limit number of aggregate functions, including SUM, COUNT, AVG, MAX and MIN. It cannot handle more complicated computations. We need to group data and calculate average age of each department using GROUP BY statement, query the employee table, and then select those whose age is below the average through an inner join.
select *
from EMPLOYEE t1
inner join
(select
DEPT, avg(TRUNC(months_between(sysdate, BIRTHDAY)/12)) AVG_AGE
from EMPLOYEE
group by DEPT) t2
on t1.DEPT=t2.DEPT and
TRUNC(months_between(sysdate, t1.BIRTHDAY)/12)<t2.AVG_AGE
SPL solution:
SPL provides A.group() function to perform grouping. We can define an operation on each post-grouping subset in the function. The operation can be a more complicated one besides those SQL-supported aggregate functions.
A |
|
1 |
=T("Employee.csv") |
2 |
=A1.group(DEPT; (a=~.avg(age(BIRTHDAY)), ~.select(age(BIRTHDAY)<a)):YOUNG) |
3 |
=A2.conj(YOUNG) |
A1:Import the employee table.
A2:Group A1’s table by department and select records where the employee age is below the average from each department. In the aggregate operation defined within the A.group() function, we can use a temporary variable to make the computation easy to understand.
A3:Concatenate the selected records.
【Example 7】According to the following employee table, find the states where more than 50 employees are based and calculate the average salary of these states. Below is part of the source table:
ID |
NAME |
BIRTHDAY |
STATE |
DEPT |
SALARY |
1 |
Rebecca |
1974/11/20 |
California |
R&D |
7000 |
2 |
Ashley |
1980/07/19 |
New York |
Finance |
11000 |
3 |
Rachel |
1970/12/17 |
New Mexico |
Sales |
9000 |
4 |
Emily |
1985/03/07 |
Texas |
HR |
7000 |
5 |
Ashley |
1975/05/13 |
Texas |
R&D |
16000 |
… |
… |
… |
… |
… |
… |
SQL solution:
In the natural way of thinking, we will group data by state, select states with more than 50 employees, group records of these states by department, and calculate average salary in each department. This is complicated to implement as SQL GROUP BY cannot retain the post-grouping subsets. SQL will group employee records by state, select those having states with more than 50 employees, then group the selected ones by state and department to calculate the average salary of each department in each state, and finally, select records where states correspond to over 50 employees and where the employee ages are below the averages of the corresponding departments. Below are the SQL queries:
select
t1.STATE,DEPT,AVG_SALARY
from
(select
STATE,DEPT,AVG(SALARY) AVG_SALARY
from EMPLOYEE
group by STATE,DEPT
order by STATE,DEPT) t1
inner join
(select
STATE, COUNT(*)
from EMPLOYEE
group by STATE
HAVING COUNT(*)>50) t2
on t1.STATE=t2.STATE
SPL solution:
As a grouping operation is not simple in itself, the reuse of post-grouping subsets can increase efficiency. SPL A.group() function can keep the subsets after grouping operation and perform further grouping and aggregation or other operation on them.
A |
|
1 |
=T("Employee.csv") |
2 |
=A1.group(STATE).select(~.len()>50) |
3 |
=A2.conj(~.groups(DEPT; avg(SALARY):AVG_SALARY).derive(A2.~.STATE:STATE)) |
A1:Import the employee table.
A2:Group A1’s table by state and get subsets where the number of members is above 50.
A3:Group each subset of state by department and calculate the average salary in each department, and then concatenate result sets.
Summary
SPL and SQL are intrinsically different in implementing the grouping operation. Besides returning the aggregates, a SQL grouping operation allows you to select the grouping field and the aggregates if the result set is queried. A SPL grouping operation puts records having same attribute into a same group (subset) and the post-grouping subsets contains all information of the original data. The complicated grouping operation can thus become efficient thanks to the reusability of the post-grouping subsets.
When the query is complicated, the complexity of SQL query increases by multiple times. It involves the use of temporary table and nested query, etc, which makes it harder to write and maintain the SQL query. SPL, however, can compose succinct code step by step according to the natural way of thinking.
The SPL-driven esProc is the professional data computation engine. It is ordered-set-based and offers a complete set of grouping functions, which makes the marriage of both Java and SQL advantages. A grouping operation in SPL will thus become simple and easy.
SPL Official Website 👉 http://www.scudata.com
SPL Feedback and Help 👉 https://www.reddit.com/r/esProc
SPL Learning Material 👉 http://c.scudata.com
SPL Source Code and Package 👉 https://github.com/SPLWare/esProc
Discord 👉 https://discord.gg/ydhVnFH9
Youtube 👉 https://www.youtube.com/@esProc_SPL

