

General SQL-style Operations in SPL
After we retrieve data from the data source as a table sequence in SPL, we can perform all SQL-style operations, such as filtering, aggregation, inter-column calculations, sorting, grouping & aggregation, top-N, post-grouping top-N, distinct, post-grouping distinct, and join to name a few. In this essay, we take the file data source to explain how to achieve those operations on a SPL table sequence.
1. Filtering
A filtering operation selects records that meet the specified condition (s) from a data table.
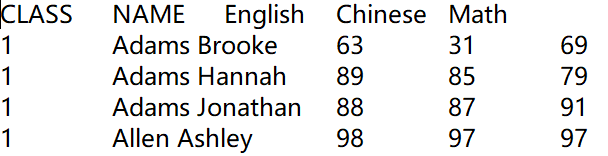
Example: Get scores of students in class 10 from the following student scores table Students_scores.txt. The first row of the file contains column names, and detailed data begins from the second row, as shown below:
A |
|
1 |
=T(“E:/txt/Students_scores.txt”).select(CLASS==10) |
A1 Reads data from the file and selects records of class 10. The T function chooses the appropriate separator automatically according to the file extension.
2. Aggregation
An aggregate operation summarizes data in a table.
Example: Calculate the average Chinese score, the highest math score, and the total English score on all students.
A |
|
1 |
=T(“E:/txt/Students_scores.txt”) |
2 |
=A1.avg(Chinese) |
3 |
=A1.max(Math) |
4 |
=A1.sum(English) |
A1 Read data from the file, during which T function automatically selects the suitable separator according to the file extension.
A2 Calculate the average Chinese score.
A3 Get the highest math score.
A4 Calculate the total English score.
3. Inter-column calculations
The inter-column calculation performs a specific operation requiring values of multiple columns.
Example 1: Calculate each student’s total score based on the student scores table.
A |
|
1 |
=T(“E:/txt/Students_scores.txt”) |
2 |
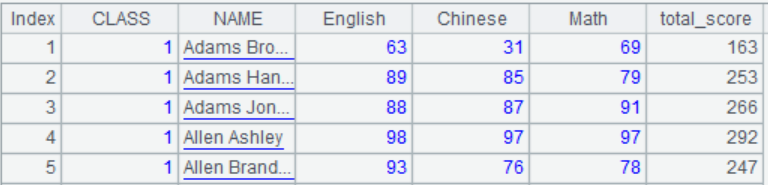
=A1.derive(English+Chinese+Math:total_score) |
A1 Read data from the file, during which T function automatically uses the right separator according to the file extension.
A2 Add a column named total_score to A1, whose values are sums of values in English, Chinese, and Math columns.
Below is A2’s result:
Example 2: Get the evaluation result for each student’s Chinese score based on the student scores table.
A |
|
1 |
=T(“E:/txt/Students_scores.txt”) |
2 |
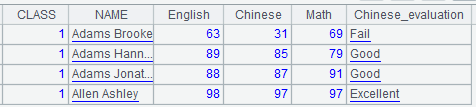
=A1.derive(if(Chinese>=90:"Excellent",Chinese>=80:"Good",Chinese>=60:"Pass","Fail"):Chinese_evaluation) |
A1 Read data from the file, during which T function automatically selects the suitable separator according to the file extension.
A2 Add a column named Chinese_evaluation to A1, whose values are Excellent, Good, Pass and Fail when the Chinese score is above 90, above 80, above 60 and below 60 respectively.
Below is A1’s result, where the computed column Chinese_evaluation is newly-added:
4. Sorting
A sorting operation sorts data in a table in ascending or descending order.
Example: Arrange records in student scores table by class number in ascending order and by total score in descending order.
A |
|
1 |
=T(“E:/txt/Students_scores.txt”) |
2 |
=A1.sort(CLASS) |
3 |
=A1.sort(CLASS,-Math) |
A1 Read data from the file, during which T function automatically selects the proper separator according to the file extension.
A2 Sort table by class number in ascending order.
A3 Sort table by class number in ascending order and then by math score in descending order.
5. Grouping & aggregation
A grouping & aggretate operation groups data and then perform a specific aggregate operation on each group.
Example: Query the lowest English score, the highest Chinese score, and the total math score in each class.
A |
|
1 |
=T(“E:/txt/Students_scores.txt”) |
2 |
=A1.groups(CLASS;min(English),max(Chinese),sum(Math)) |
A1 Read data from the file, during which T function automatically selects the fitting separator according to the file extension.
A2 Group A1 by class and get the lowest English score, the highest Chinese score, and the total math score in each class.
6. Post-grouping & -aggregation filtering
Such an operation groups and summarizes data in a table first, and then perform a filtering operation.
Example: Find classes where the average English score is below 70.
A |
|
1 |
=T(“E:/txt/Students_scores.txt”) |
2 |
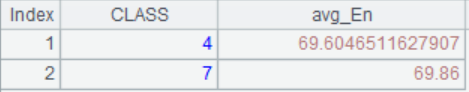
=A1.groups(CLASS;avg(English):avg_En) |
3 |
=A2.select(avg_En<70) |
A1 Read data from the file, during which T function automatically chooses the appropriate separator according to the file extension.
A2 Group A1 by class, calculate the average English score in each class, and name the new column avg_En.
A3 Select from A2 records where the average English score is below 70.
Below is A3’s result:
7. Getting top-N
A top-N operation gets the first N records or values meeting a specified condition from a data table.
Example: Get score records of the three students whose English scores rank in top 3.
A |
|
1 |
=T(“E:/txt/Students_scores.txt”) |
2 |
=A1.top(-3;English) |
A1 Read data from the file, during which T function automatically chooses the right separator according to the file extension.
A2 Sort A1 by English score in descending order and get records of three students whose English scores rank in top 3.
8. Getting top-N from each group
Group data in a table and then get top-N records or values from each group.
Example: Get score records of the three students whose English scores rank in the lowest 3 from each class.
A |
|
1 |
=T(“E:/txt/Students_scores.txt”) |
2 |
=A1.groups(CLASS;top(3,English)) |
A1 Read data from the file, during which T function automatically chooses the corresponding separator according to the file extension.
A2 Group A1 by class, sort each class by English score, and get the three lowest English scores from each class.
Here the top function uses the comma to separate parameters and return a sequence of top-N values of the sorting expression. When the function uses the semicolon to separate parameters, it returns a sequence of records containing the top-N values the specific field.
9. Distinct
A distinct operation removes duplicates from a data table.
Example: Get all class numbers.
A |
|
1 |
=T(“E:/txt/Students_scores.txt”) |
2 |
=A1.id(CLASS) |
A1 Read data from the file, during which T function automatically chooses the corresponding separator according to the file extension.
A2 Get all unique class numbers from A1.
10. Count distinct
Such an operation eliminates the repetitive appearance of the specific data from a table and perform count.
Example: Calculate the total class numbers.
A |
|
1 |
=T(“E:/txt/Students_scores.txt”) |
2 |
=A1.icount(CLASS) |
A1 Read data from the file, during which T function automatically chooses the right separator according to the file extension.
A2 Count the unique class numbers.
11. Intra-group count distinct
The operation groups data in a table and count the unique appearances of the specific data in each group.
Example: Count dates having sales records for each product based on the following sales table sales.txt.
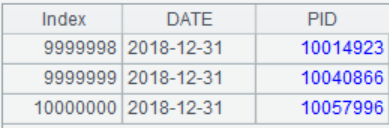
A |
|
1 |
=T(“E:/txt/sales.txt”) |
2 |
=A1.groups(PID;icount(DATE):days) |
A1 Read data from the file, during which T function automatically gets the right separator according to the file extension.
A2 Group A1 by product number PID, and count unique dates in each group and name the new column days.
12. Foreign key association
For two data tables, certain fields in table A associate with table B’s primary key, then table B is called table A’s foreign key table and this association is called foreign key association.
Example: The order information and the product information is stored in two Excel files respectively. We are trying to calculate the sales amount in each order. Data structures of the two files are as follows:
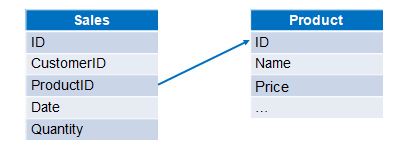
There are two methods to handle the single foreign key association.
Method 1:
A |
|
1 |
=T(“e:/orders/sales.xlsx”) |
2 |
=T(“e:/orders/product.xlsx”).keys(ID) |
3 |
=A1.switch(ProductID,A2:ID) |
4 |
=A3.derive(Quantity*ProductID.Price:amount) |
A1 Read orders data.
A2 Read product data and set ID as the primary key.
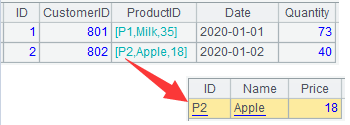
A3 The switch function associates A1’s ProductID with A2’s ID (ID can be omitted if it is the primary key) and the original ProductID values are converted into the corresponding product records, as shown below:
A4 A3 adds a new column named amount, whose values are results of sales quantity Quantity multiplied by product price Price. The expression ProductID.Price means value of Price field in the record pointed by ProductID field.
Method 2:
A |
|
1 |
=T(“e:/orders/sales.xlsx”) |
2 |
=T(“e:/orders/product.xlsx”).keys(ID) |
3 |
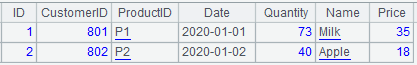
=A1.join(ProductID,A2:ID,Name,Price) |
4 |
=A3.derive(Quantity*Price:amount) |
A1 Read orders data.
A2 Read product data and set ID as the primary key.
A3 The join function associates A1’s ProductID with A2’s ID (ID can be omitted if it is the primary key) and introduces Name and Price fields from A2, as the following pic shows:
A4 A3 adds a new column named amount, whose values are results of sales quantity Quantity multiplied by product price Price.
The switch function cannot be used for multi-foreign-key association. Instead, the join function should be used to do that. Suppose the Prices are different for different types of packaging, and we add a Packing field to both the product information table and the orders information table. Now the product information table has a composite primary key of ID field and Packing field. Below are parts of the two tables:
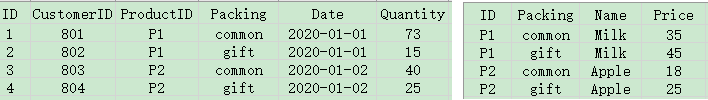
Now we are trying to calculate the amount in each order:
A |
|
1 |
=T(“e:/orders/sales.xlsx”) |
2 |
=T(“e:/orders/product.xlsx”).keys(ID,Packing) |
3 |
=A1.join(ProductID:Packing,A2,Name,Price) |
4 |
=A3.derive(Quantity*Price:amount) |
A1 Read orders data.
A2 Read product data and set ID and Packing as the primary key.
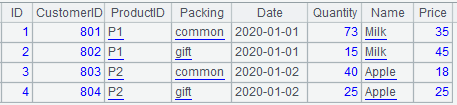
A3 The join function associates A1’s ProductID and Packing fields with A2’s primary key and introduces Name and Price fields from A2, as the following pic shows:
A4 A3 adds a new column named amount, whose values are results of sales quantity Quantity multiplied by product price Price.
13. Primary key association
For table A and table B associated through their primary keys, they are called homo-dimension tables. The homo-dimension tables have a one-to-one relationship and, logically, can be treated as a single table. Homo-dimension tables are associated via primary keys and their records have a unique correspondence.
There are employee information table (employee.xlsx) and salary table (salary.xlsx). Both use Eid as the primary key. Below are parts of the tables:
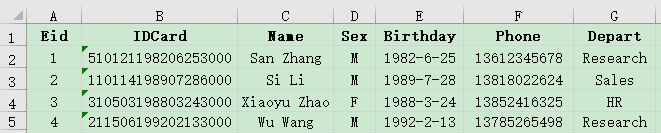
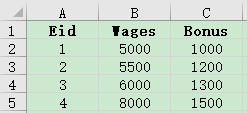
We are trying to get the basic employee information and the corresponding salary information:
A |
|
1 |
=T("e:/work/employee.xlsx") |
2 |
=T("e:/work/salary.xlsx") |
3 |
=join(A1:emp,Eid;A2:salary,Eid) |
4 |
=A3.new(emp.Eid,emp.IDCard,emp.Name,emp.Sex,emp.Phone,emp.Depart,salary.Wages,salary.Bonus) |
A1 Read employee information.
A2 Read salary information.
A3 Join A1 and A2 through Eid, during which A1 is named emp and A2 is named salary.
A4 Select Eid, IDCard, Name, Sex, Phone and Depart from A3’s emp and Wages and Bonus from A3’s salary to create a new table sequence.
The primary key association may happen between the main table and the subtable. For table A and table B when the former’s primary table associates with part of the latter’s primary key, then table A is called the main table and table B is the subtable. The main table and the subtable has a one-to-many relationship.
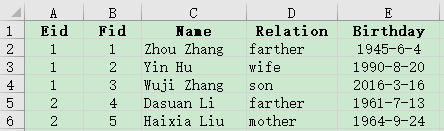
Here is employee family table (family.xlsx) where the primary key is made up of Eid field and Fid field. We are trying to get information of employees who has at least a family member who are above 70.
A |
|
1 |
=T("e:/work/employee.xlsx") |
2 |
=T("e:/work/family.xlsx").select(age(Birthday)>=70) |
3 |
=join(A1:employee,Eid;A2:family,Eid) |
4 |
=A3.conj(employee) |
A1 Read employee information.
A2 Read employee family information and get records of members whose ages are above 70.
A3 Perform a filtering join on A1 and A2 through Eid by deleting non-matching records and during which A1 is named employee and A2 is named family.
A4 Get employee column from A3 to concatenate its records as table sequence.
SPL Official Website 👉 http://www.scudata.com
SPL Feedback and Help 👉 https://www.reddit.com/r/esProc
SPL Learning Material 👉 http://c.scudata.com
SPL Source Code and Package 👉 https://github.com/SPLWare/esProc
Discord 👉 https://discord.gg/ydhVnFH9
Youtube 👉 https://www.youtube.com/@esProc_SPL

