

2.2 Using spl() function
Once the add-in is installed and configured, the spl() function will be available in Excel for executing the SPL script in Excel cell and obtaining the calculated result set.
The spl() function has two parameter formats:
1. spl(exp, arg1, …)
| exp |
| It is an expression string in SPL syntax, starting with =. In the string, the question mark is used to represent the referenced parameter; ?1 corresponds to the first parameter, and ?2 corresponds to the second one, and so on. |
| arg1,… |
| It is the parameter value. There can be none or multiple parameters (30 at most). You can fill in the constants, or reference the current Excel cell (a single cell or a range of cells are allowed). |
For complex computing requirements, execute the script file coded in SPL in the format of:
2. spl(splx(…), … )
| splx() |
| It is the script file name without an extension. .splx will be added mandatorily, and must be followed by parentheses ().If the script has parameters, it also needs to write ?1,?2,.. etc. in () to indicate these parameters. |
| arg1,… |
| It is the parameter required by corresponding to the script file in turn. You can reference a single Excel cell or a range of cells. |
The spl() function may return a single value, a one-dimensional array or a two-dimensional array.
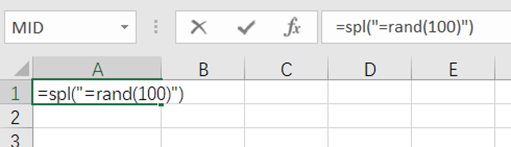
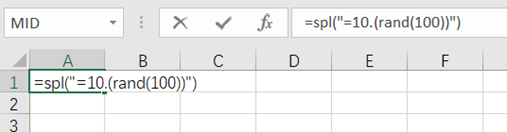
2.2.1 No parameters
To generate random integers within 100:
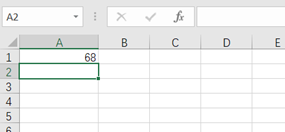
Calculation result:
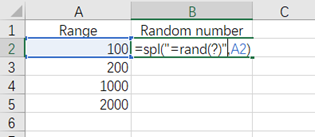
2.2.2 A single parameter
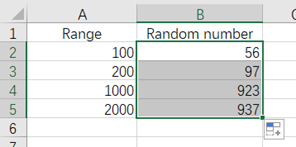
In the following Excel file, the first column is the range of random integers, and the second column is the number of the integers randomly generated according to the range given in the first column:
Calculation result:
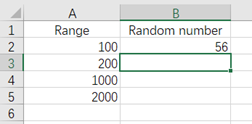
Drag B2 down to every relevant cell to obtain the results:
2.2.3 Double quotation marks exist in expression
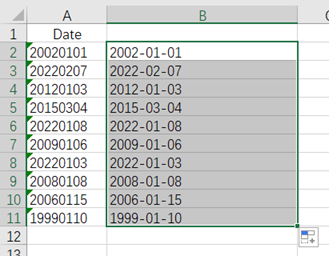
Here’s an Excel file containing date data:
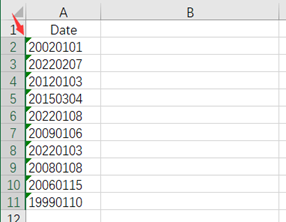
These data are not in date format and cannot be recognized by Excel. Instead, they are regarded as common string of numbers. Now we need to convert them to date type data.
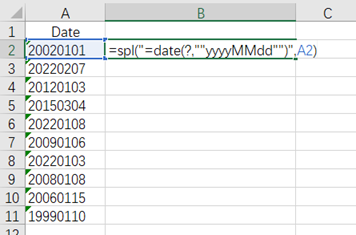
SPL provides a simple writing method: =date(A2,“yyyyMMdd”), which can parse A2 to the date format in the form of “yyyyMMdd”. Such SPL script itself, however, contains double quotation marks that, when writing into the spl() function, need to be escaped according to the Excel rule by writing "as"", as shown below:
The result is as follows:
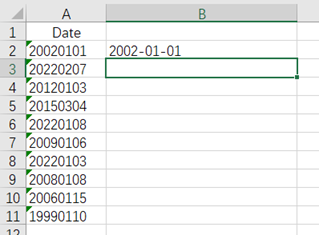
Drag B2 down to every relevant cell to get the results:
Notes:
You need to first set the type of cell where the date data is located to text type.
2.2.4 Multiple parameters
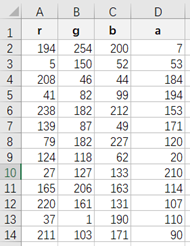
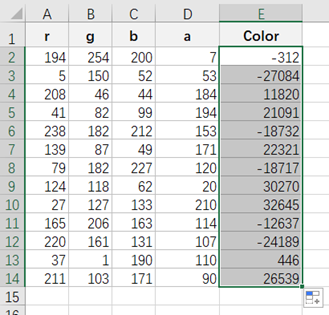
In the following Excel file, the r, g, b, a represent the red, green, blue and transparency component respectively:
Now we want to add a column on the right to compute the color value combined by the color components of each row. Enter the SPL code as follows:
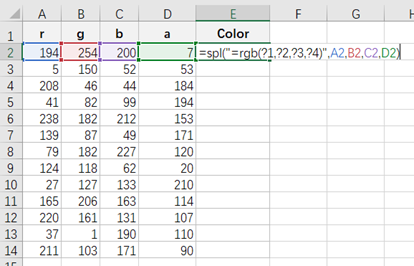
In this code, ?1,?2,?3,?4 respectively corresponds to the first parameter A2, the second parameter B2, the third parameter C2 and the fourth parameter D2.
After entering the above expression, the color value of the current row can be calculated as follows:
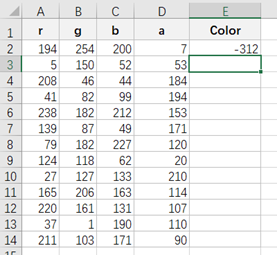
Then drag E2 down to every relevant cell to obtain all results:
2.2.5 A single-row range parameter
According to the following Excel file, we want to calculate the median of each row after removing the largest value and the smallest value in each row, and then fill the result in the rightmost column:
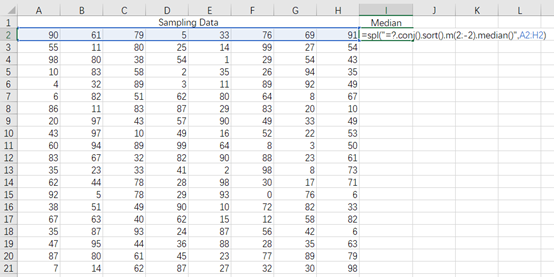
Enter =spl(“=?.conj().sort().m(2,-2).median()”,A2:H2) in I2, and Excel will pass the array combined by the range of cells A2:H2 to SPL expression “=?.conj().sort().m(2,-2).median()” to replace the parameter ? in it, and return the median with the largest and the smallest values removed.
Below is the result:
Notes:
1. Excel will automatically convert the array parameter to a two-dimensional array, even if there is actually only one row (or one column). Therefore, there is a need to use conj() in the SPL script to concatenate into a single-level sequence.
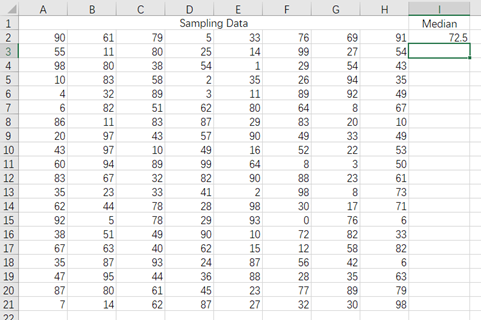
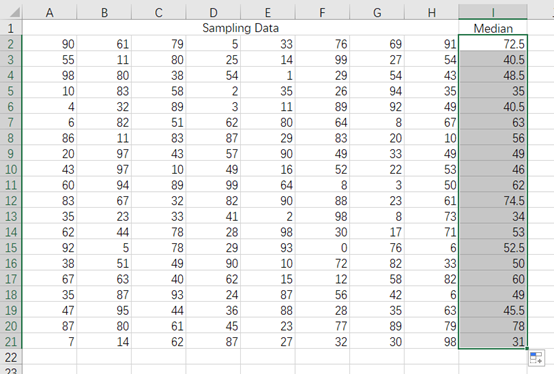
At his point, dragging I2 down to every relevant row can automatically compute the median of every row, as shown in the figure blow:
2.2.6 A single-column range parameter
According to the following Excel file, we want to calculate the median of each column after removing the largest value and the smallest value in each column, and then fill the result in the bottom row:
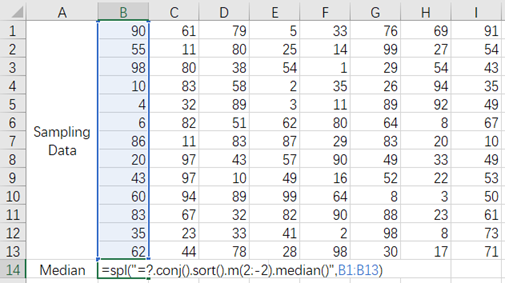
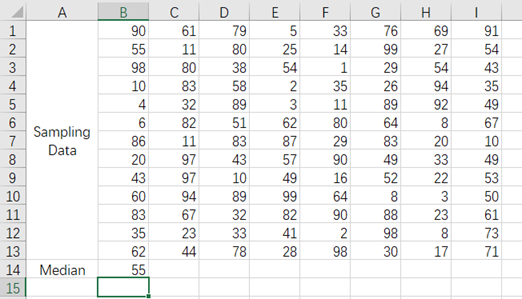
Enter =spl(“=?.conj().sort().m(2,-2).median()”,B1:B13) in A14, and Excel will pass the array combined by the range of cells B1:B13 to SPL expression “=?.conj().sort().m(2,-2).median()” to replace the parameter ? in it, and return the median with the largest and the smallest values removed.
Below is the result:
Notes:
1. Excel will automatically convert the array parameter to a two-dimensional array, even if there is actually only one row (or one column). Therefore, there is a need to use conj() in the SPL script to concatenate into a single-level sequence.
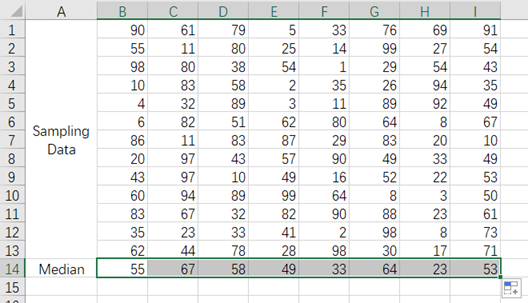
At this point, dragging B14 right to every relevant column can automatically compute the median of every column on the right, as shown in the figure blow:
2.2.7 Multi-row, multi-column range parameter
According to the following Excel file:
We want to add a column on the right to calculate the cumulative average of sampling data. That is, for the row of the first day, compute the average of the first day; for the row of the second day, compute the average of the first two days; for the records of the third day, compute the average of the first three days, and so on. Likewise, we remove the largest and the smallest values before computing the average.
Below is the result:
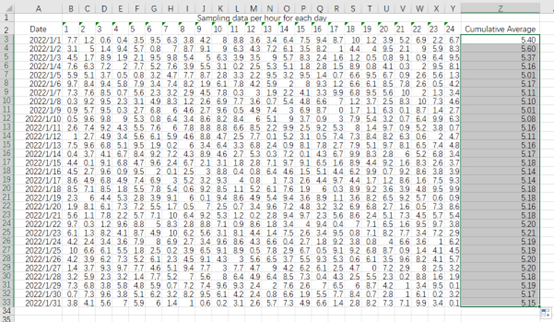
Enter the expression: =spl(“=?.conj().sort().m(2:-2).avg()”,$B$3:Y3) in Z3 and get the result 5.40.
As can be seen from the expression that the parameter passed in is $B$3:Y3, where the first cell B3 is added with two symbols $, the reason is that we should always keep accumulating from cell B3 when copying the expression down since what we want to calculate is the cumulative average.
Drag Z3 down to every relevant row to get the cumulative average of every row.
2.2.8 Mixed parameters
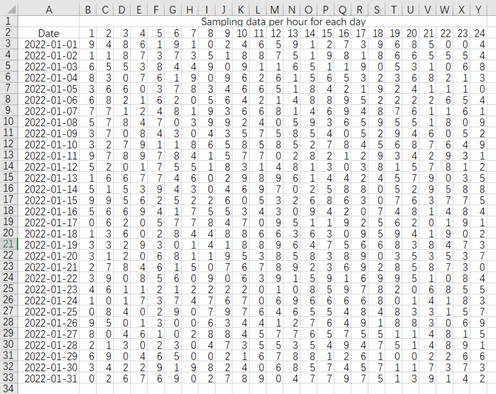
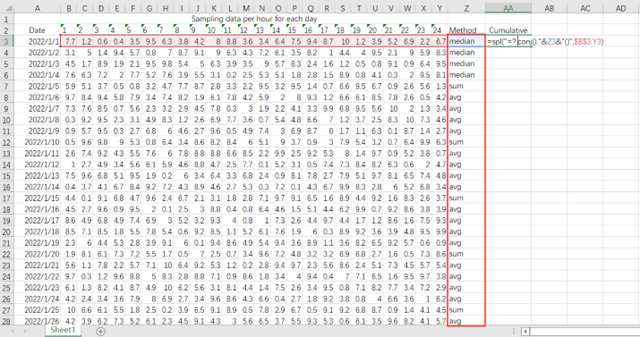
The following Excel file contains the sampling data per hour for each day:
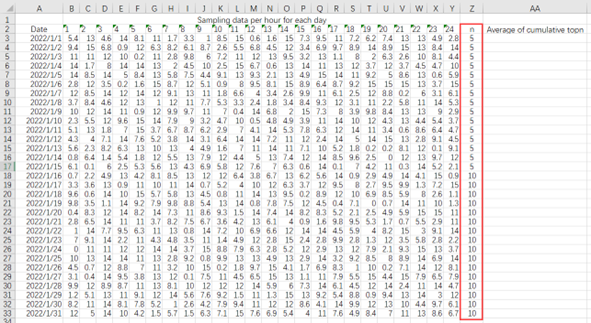
Now we want to add a column on the right to calculate the average of the largest n values in all sampling data of this month as of the current day, and n is determined by the data in column Z.
Enter the SPL expression in AA3 as follows:
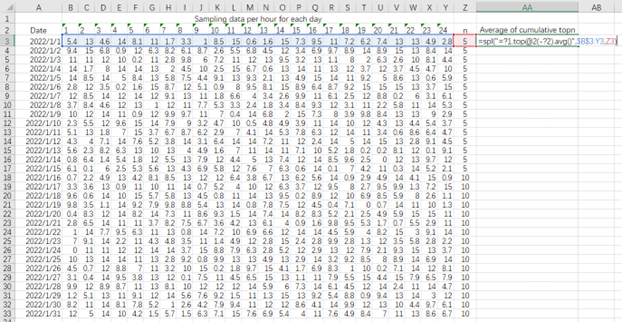
=spl("=?1.top@2(-?2).avg()", $B$3:Y3, Z3)
The first parameter =?1.top@2(-?2).avg() is the SPL expression, which means that the top n values are calculated for parameter ?1, and n is determined by parameter ?2; Then calculate the average of top n values.
The second parameter $B$3:Y3 is the parameter passed to SPL expression and corresponds to ?1
The third parameter Z3 is the parameter passed to SPL expression and corresponds to ?2.
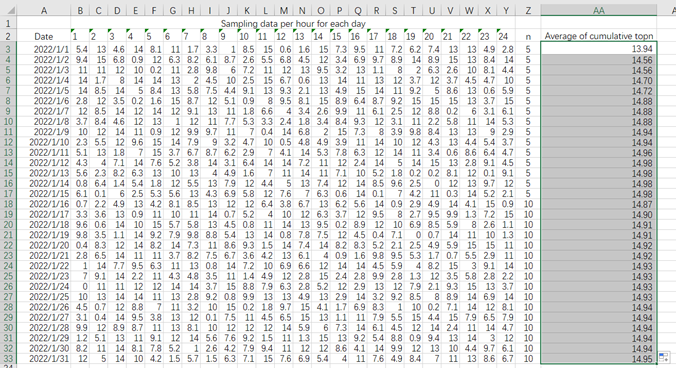
Drag AA3 down to every relevant row to get the final result:
2.2.9 Return a one-dimensional array
To generate 10 random integers within 100 and fill them in the first row in sequence:
After Entering the expression in A1, press Ctrl-Enter to execute the macro defined in esproc_template.xla, and fill the calculation result into adjacent cell:
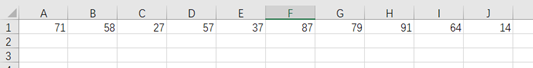
When the expression returns a one-dimensional array, pressing Ctrl-Enter will fill all members of the array into a row of cells from left to right beginning from the current cell. If you don’t use the hotkey, only the first member is filled into the cell holding the expression.
2.2.10 Return a two-dimensional array
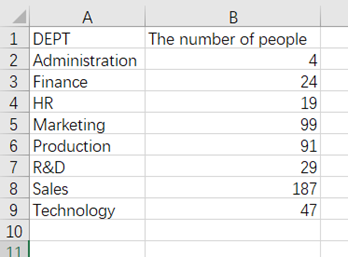
We have an Employee.xlsx file:
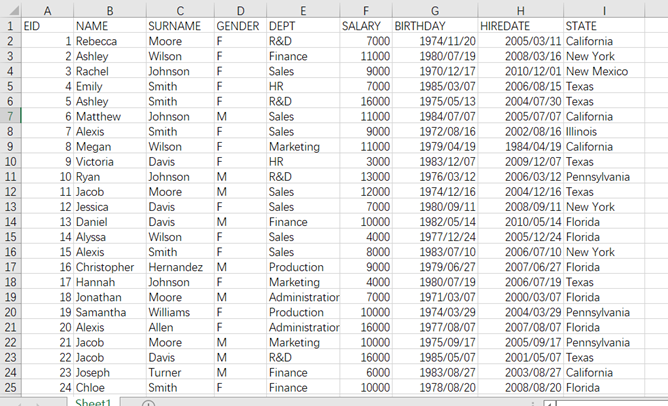
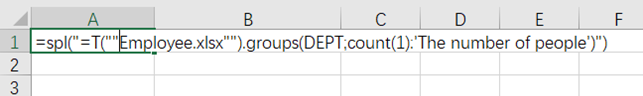
We want to count the number of employees in each department by the column DEPT. Enter the SPL script in A1 as follows:
This Excel file is preferably stored under esProc main path, so that it can be located without writing the path name, otherwise its full path name needs to be written in the expression.
Press Ctrl-Enter to fill the calculation result into adjacent cell:
Notes:
1. You need to press Ctrl-Enter to trigger the fill action when a two-dimensional array is returned. Values will be filled rightward and downward to a range of cells beginning from the current cell. Only the first member of the array is filled into the cell holding the expression if the hotkey isn’t used.
2. If there is "in the SPL script, it needs to be escaped to"" according to the Excel rule.
2.2.11 Concatenate SPL expression dynamically
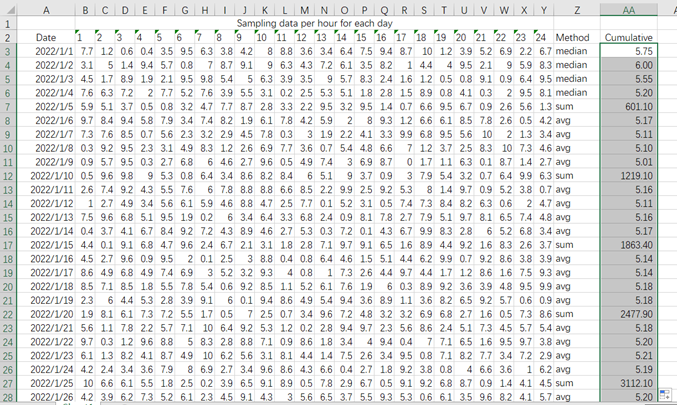
According to the following Excel file:
Now we want to add a column on the right to compute the cumulative aggregate of sampling data. The aggregate function is determined by the function name given in column Z. If it is median, compute the median; if it is avg, compute the average; if it is sum, compute the sum, and so on.
Enter the expression: =spl(“=?.conj().”&Z3&“()”,$B$3:Y3) in AA3, where the first parameter “=?.conj().”&Z3&“()” is a dynamically concatenated SPL expression; the second parameter $B$3:Y3 is to pass in an array consisting of values in the range of B3:Y3.
In the pass-in parameter $B$3:Y3, the first cell is added with two symbols $, the reason is that we should always keep accumulating from cell B3 when copying the expression down since what we want to calculate is the cumulative aggregate, and this cell should remain unchanged.
Drag AA3 down to every relevant row to get the cumulative aggregate of every row.
esProc Desktop and Excel Processing
2.1 Installation and Configuration
2.3 Editing SPL code
SPL Official Website 👉 http://www.scudata.com
SPL Feedback and Help 👉 https://www.reddit.com/r/esProc_Desktop/
SPL Learning Material 👉 http://c.scudata.com
Discord 👉 https://discord.gg/ydhVnFH9
Youtube 👉 https://www.youtube.com/@esProcDesktop
Linkedin Group 👉 https://www.linkedin.com/groups/14419406/

