

Although AI modeling & predicting in Python is popular, SPL is also a good alternative to get started
There are many tools that can be used for AI modeling and prediction, such as Python, R, SAS and SPSS, where Python is very popular because it is simple, easy to learn, rich in data science libraries, open source and free. However, modeling in Python is still complicated for programmers who are not very familiar with data modeling algorithms. In many cases, they have no idea to start and do not know which algorithm to choose when they have data. In fact, SPL is also a good choice when performing data analysis and modeling task since SPL is simpler and easier to use than Python and fast in calculation speed. In addition, SPL provides an interactive interface that is very friendly to data analysis, and also provides easy-to-use automated data modeling functionality and some data processing and statistical functions.
This article will teach you the detailed steps to build data model and predict in SPL by taking a data table of client loan default prediction as an example.
1. Determine an objective, prepare data
Data modeling and prediction are to mine historical data to find the regular pattern, and then utilize the pattern to predict what might happen in the future. This pattern is what is generally referred to as a model.
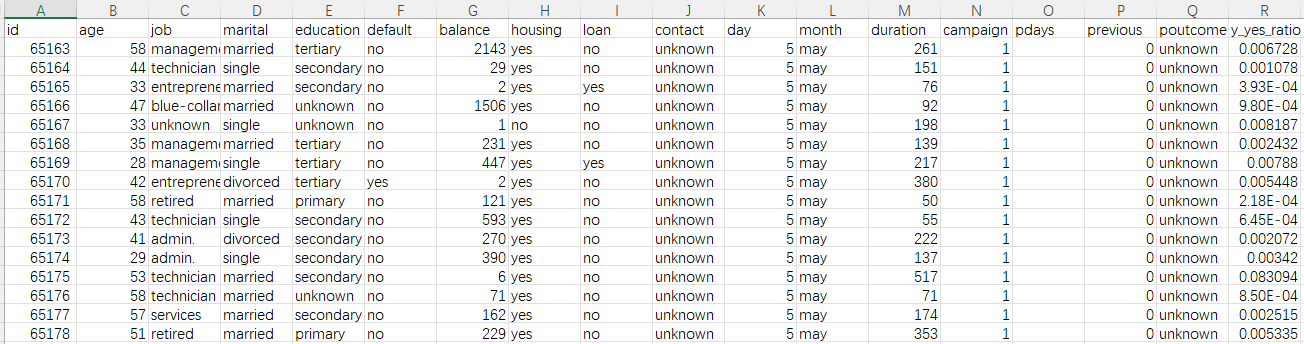
Historical data is usually what we commonly call a wide table. For instance, the historical data of client loan default prediction is an Excel table as shown below:

To build data model and predict, the prerequisite is that the data (wide table) must include what we want to predict, usually called the prediction target. The prediction target in this example is the default behavior of historical clients, that is, the y column. In this column, yes means default occurred and no means default did not occur. The prediction target can also be a value (such as a product’s sales and price), or a category, for example, you may want to know what category the quality of to-be-predicted target falls into (excellent, good, acceptable or poor). Sometimes the targets are available in raw data and can be got directly, yet sometimes the targets need to be annotated manually.
In addition to the prediction target, a lot of information is needed for prediction, such as client’s age, job, housing and loan in the table. Each column is called a variable, which is the information associated with whether the lender will default in the future. In principle, the more variables that can be collected, the higher the prediction accuracy. For example, to predict whether a customer will buy a product, you need to collect customer’s behavior information, shopping preference, product feature information and promotion strength, etc.; to predict the claim risk of vehicle insurance, you need to collect the policy data, vehicle information, vehicle owner’s traffic habits and historical claim information, etc.; to predict a health insurance, you need to collect information about the insurant’ living habits, physical condition, medical treatment and medical visit and so on; to predict the sales of a mall/supermarket, you need to collect historical sales orders, customer information and product information; to predict defective products, you need to collect the data like production process parameters, environment and raw material condition. In short, the more relevant information is collected, the better the prediction effect will be.
When collecting data, it is common to clip out the historical data of a certain period to create a wide table. For example, if you want to predict client default situation of July, you can collect the data of January to June to build a model. The time range of collecting data is not fixed and can be chosen flexibly, for example, you can choose a time range of the past year or the last 3 months.
The ready wide table can be saved as xls or csv format, with the first row being the title and each subsequent row being a history record.
If a business has constructed the information system, then you can ask the IT department for relevant data. Many businesses can export such data directly from their BI system.
2. Download software, configure YModel external library
With the aid of YModel external library, SPL can provide a fully automated data modeling and prediction functionality.
(1) Download and install esProc (SPL) and YModel
Install esProc and YModel, and record the installation directory like C:\Program Files\raqsoft\ymodel

(2) Configure external library in SPL
(a) Copy files required for external library
Find the following jars in the installation directory of YModel, and copy them to external library path like “C:\Program Files\raqsoft\esProc\extlib\Ym2Cli”.

(b) SPL environment configuration
1>. Configure external library
Open SPL, and go to Tool > Options > Environment, then check YModel external library in Select external libraries. Restarting your computer will make the changes take effect.
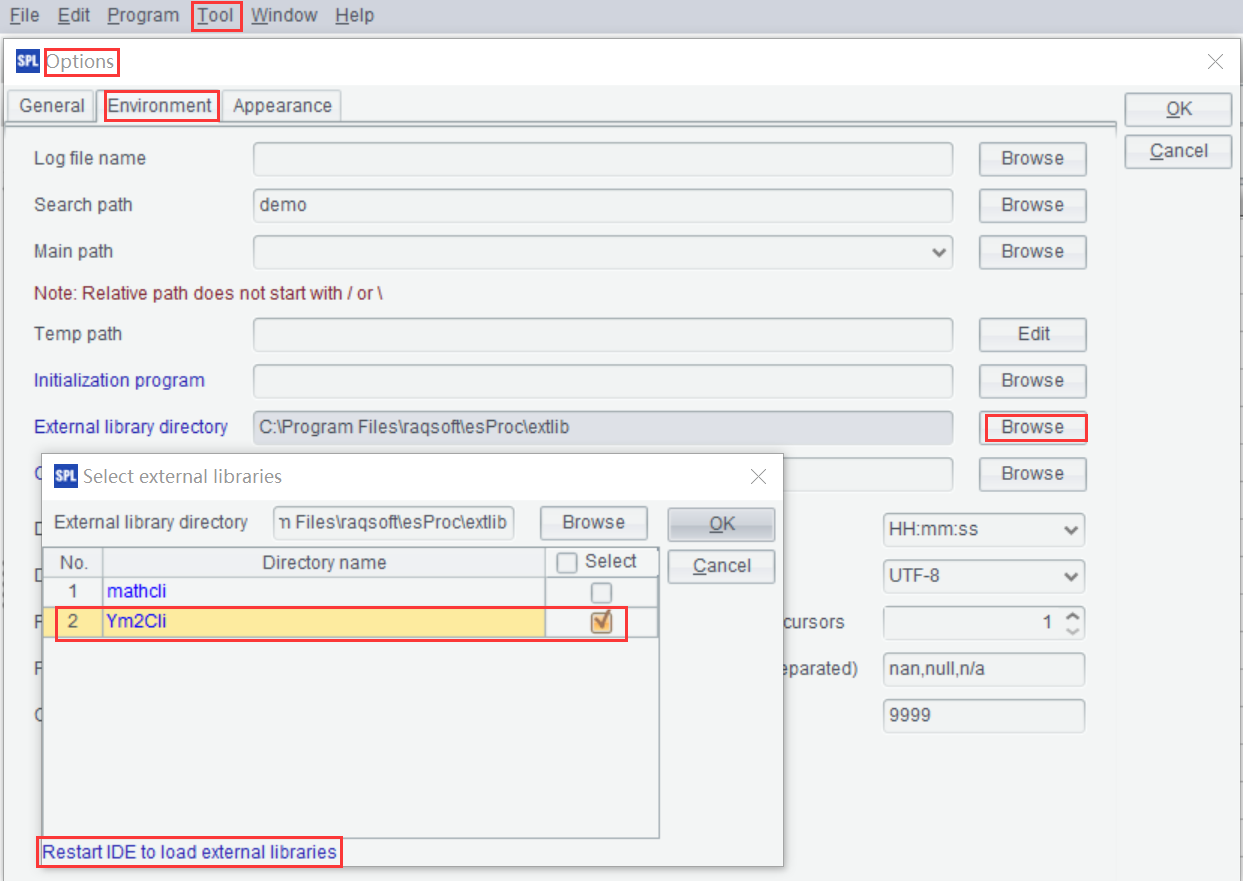
For servers without GUI, the path and name of external library can be set in the file ‘esProc\config\raqsoftConfig.xml’, which is under the installation directory of esProc.
<extLibsPath> external library path
< importLibs > external library name (multiple names allowed)
2>. Set number of threads
If concurrency prediction is involved, it also needs to set the “parallel limit” in SPL, i.e., the number of threads. Users can select the number of threads according to their needs and machine condition.
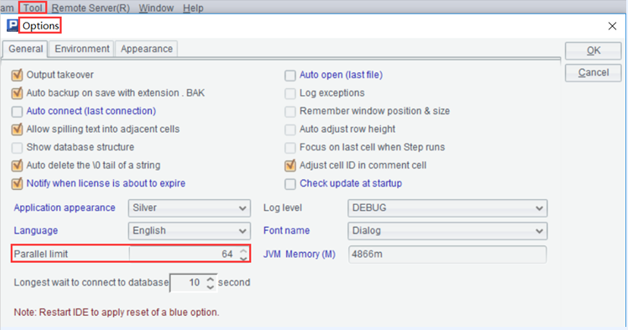
For servers without GUI, the parallel limit can be set in the file ‘esProc\config\raqsoftConfig.xml’, which is under the installation directory of esProc.
<parallelNum>parallel limit
Up to this point, environment configuration is completed.
3. Modeling and prediction
(1) Generate mcf file using YModel
Before using SPL for modeling, it needs to resort to YModel to perform some tasks like data loading, target variable setting, variable selection, model configuration, and save them as mcf files. For instructions on how to use YModel, visit: https://doc.scudata.com/YModel/userrefer/
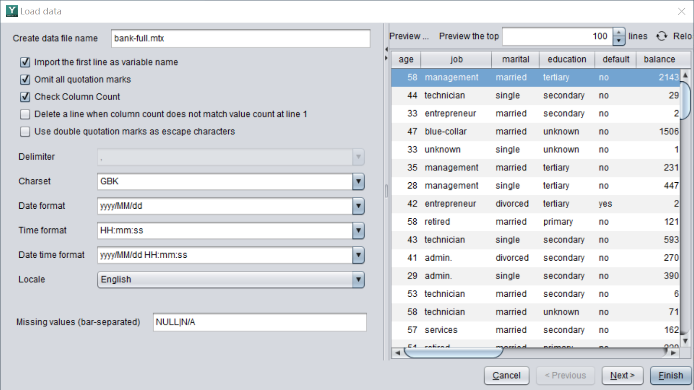
Suppose there is a loan default data table as follows, we want to build a model to predict whether or not new clients will default.
The file name is bank-full.csv.
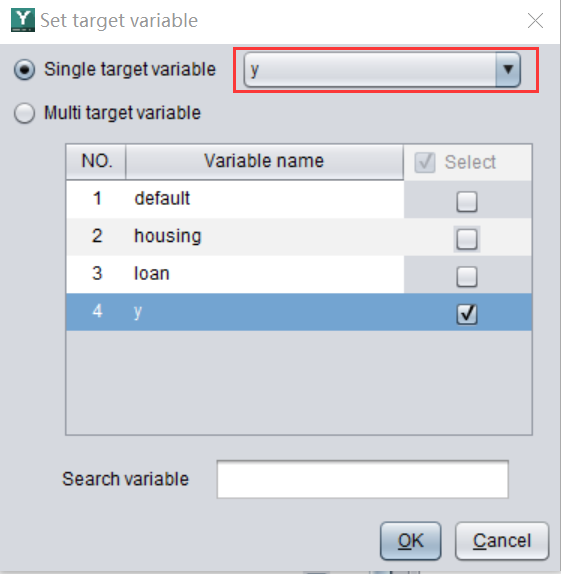
First, use YModel to import data, and then select ‘y’ as the target variable (prediction target) and save it as bank-full.mcf.

(2) Import mcf file and build a model
Open SPL and import the configured mcf file to start modeling.
| A | |
| 1 | =ym2_env("C:/Program Files/raqsoft/ymodel") |
| 2 | =ym2_mcfload("bank-full.mcf") |
| 3 | =ym2_model(A2) |
| 4 | =ym2_pcfsave(A3,"bank-full.pcf") |
A1: initialize environment; ym2_env(appPath, configFile, pythonPath), appPath: installation path of YModel; configFile: userconfig.xml configuration file. By default, the last two don’t need to be set.
A2: import the configured mcf file.
A3: build a model.
A4: save the model.
(3) Check the performance of the model
| A | |
| … | … |
| 5 | =ym2_pcfload("C:/Users/29636/Desktop/tmp/bank-full.pcf") |
| 6 | =ym2_result@p(A5) |
| 7 | =ym2_result@r(A5) |
| 8 | =ym2_result@i(A5) |
| 9 | >ym2_close() |
A5: import the model.
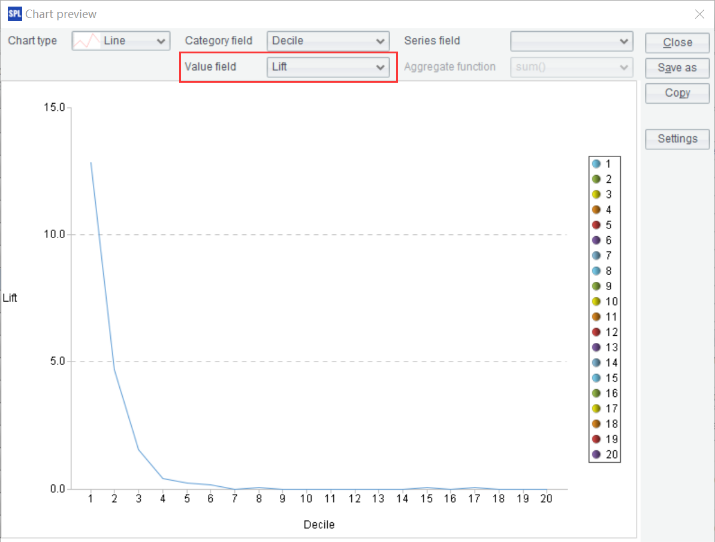
A6: return multiple model indexes and charts, such as GINI, AUC, ROC, Lift.

For example, click on the value of the 6th record of A6, then click on the “Chart preview” icon in the upper right corner and select “Lift” in the value field, you can view the Lift curve.
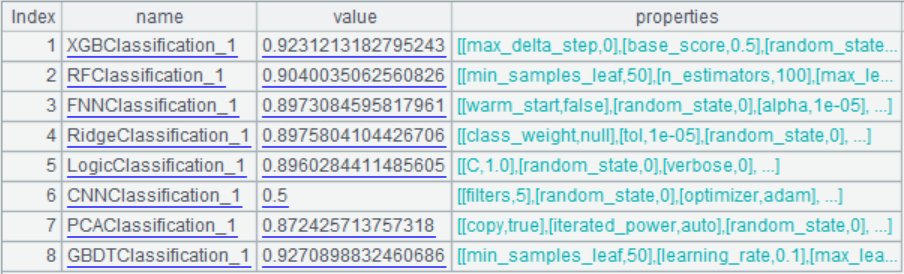
A7: return model algorithm information and parameters.
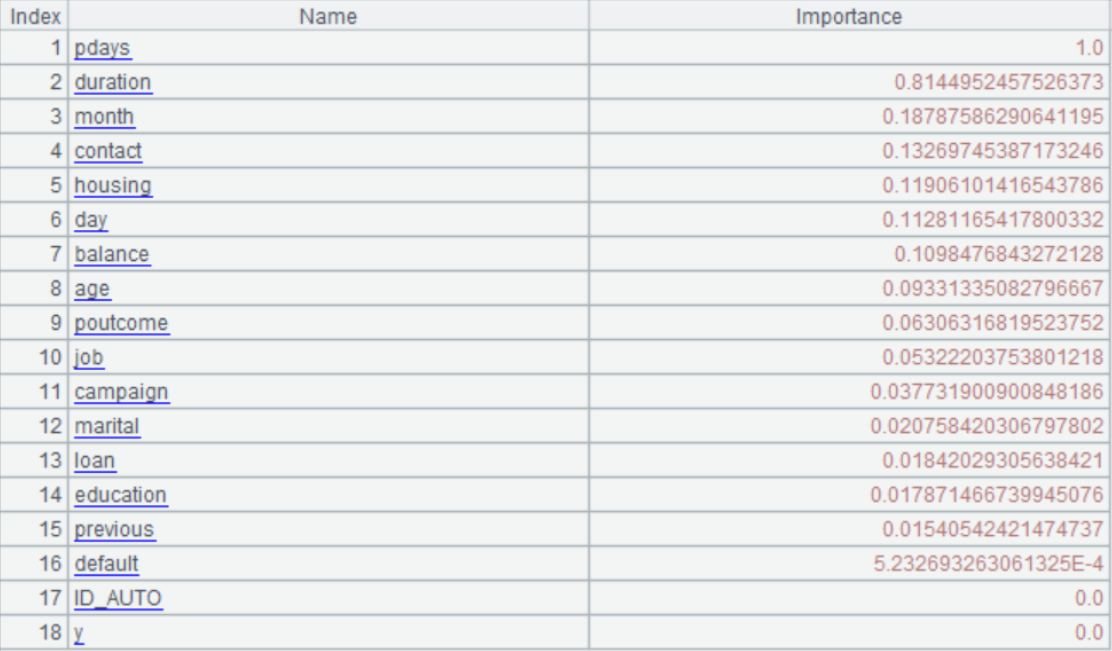
A8: return the degree of influence of each variable on the target variable, referred to as importance.
A9: close modeling window to release resources.
Note: the contents of A6, A7 and A8 can also be returned as the form of json string, we just need to add ‘j’ after the option, for example "ym2_result@pj()”.
(4) Prediction
The pcf model file and the dataset to be predicted should be available before predicting.
| A | |
| 1 | =ym2_env("C:/Program Files/raqsoft/ymodel") |
| 2 | =ym2_pcfload("bank-full.pcf") |
| 3 | =ym2_predict(A2,"bank-full.csv") |
| 4 | =ym2_result(A3) |
| 5 | =file("bank-full_result.csv").export@tc(A4) |
| 6 | >ym2_close() |
A1: initialize environment.
A2: import the pcf model file and generate a pd model object.
A3: perform prediction on csv file. In addition to csv file, the txt, cursor, table sequence and mtx files are also supported.
A4: get the prediction result.
A5: export the prediction result. In this example, the prediction result is the probability of client default.
A6: close the environment to release resources.
4. Integrating and calling
SPL can also be integrated into and called by upper-layer application. For example, SPL can be embedded in Java application. For details, visit:
http://c.raqsoft.com/article/1688035681943#toc_h2_3
Summary
It is very simple to build data model and predict in SPL and YModel, eliminating the need for programmers to understand profound mathematical principle, and thus a data modeling task can be done in just a few simply steps as long as the training data is prepared. Moreover, this functionality can be easily embedded in applications. Therefore, the complex AI is no longer the preserve of a small number of data scientists.
SPL inherently providessuper-strong data processing ability, which makes it more conveniently to pre-pare the data before utilizing AI algorithms. In addition, SPL provides a wealth of math functions. Those who have some knowledge of math and want to implement data modeling on their own can study further.
SPL Official Website 👉 http://www.scudata.com
SPL Feedback and Help 👉 https://www.reddit.com/r/esProc
SPL Learning Material 👉 http://c.scudata.com
SPL Source Code and Package 👉 https://github.com/SPLWare/esProc
Discord 👉 https://discord.gg/ydhVnFH9
Youtube 👉 https://www.youtube.com/@esProc_SPL


Chinese version: http://c.raqsoft.com.cn/article/1661388600591