Polyfit
For polynomial fitting, SPL provides the function polyfit()
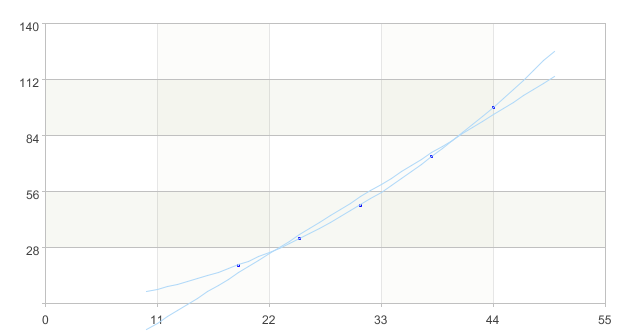
For example, again the data in the previous section, we use the form  to fit
A |
|
…… |
…… |
14 |
=polyfit(A1,A2,2).conj() |
15 |
=A10.([~,A14(3)*~*~+A14(2)*~+A14(1)]) |
16 |
=A3.plot("Line","markerStyle":0,"lineColor":-65536,"axis1":"x","data1":A15.(~(1)),"axis2":"y", "data2":A15.(~(2))) |
17 |
=A3.draw(800,400) |
A14 Pass the x and y data into the function polyfit(X,Y,n), where n is the degree of the polynomial, taking 2, and return the fitting coefficient

Rank from bottom to top, 
A15-A17 Plot the curve of a quadratic function

SPL Official Website 👉 https://www.scudata.com
SPL Feedback and Help 👉 https://www.reddit.com/r/esProc_SPL
SPL Learning Material 👉 https://c.scudata.com
SPL Source Code and Package 👉 https://github.com/SPLWare/esProc
Discord 👉 https://discord.gg/cFTcUNs7
Youtube 👉 https://www.youtube.com/@esProc_SPL


