SPL Simplified SQL - Intra-group Computing
When developing database applications, we often encounter the problem of computing data within a group after grouping.For example: List the students who have published papers every year in the past three years, count all the employees who have participated in the training, select the three days with the highest golf performance for each customer, and so on. SQL completes this kind of operation more complex, generally needs multi-layer nesting, resulting in code difficult to understand and maintain. SPL is good at expressing this kind of intra-group computing and is easy to integrate with JAVA or reporting tools. Here's an example.
Table sales stores order data for many years, some of which are as follows:
OrderID |
Client |
SellerId |
OrderDate |
Amount |
10808 |
OLDWO |
2 |
2015/1/1 |
1660 |
10809 |
WELLI |
7 |
2015/1/1 |
140 |
10810 |
LAUGB |
2 |
2015/1/1 |
187 |
10811 |
LINOD |
8 |
2015/1/2 |
852 |
10812 |
REGGC |
5 |
2015/1/2 |
1852 |
10813 |
RICAR |
1 |
2015/1/5 |
648 |
10814 |
VICTE |
3 |
2015/1/5 |
2070 |
10815 |
SAVEA |
2 |
2015/1/5 |
40 |
10816 |
GREAL |
4 |
2015/1/6 |
8891 |
According to this table, please list the customer names whose monthly sales amount is within top 20 for every month in the specified year (e.g. 2015).
To solve this problem, we need to select the sales data of 2015, then grouped by month, and looped to select the top 20 customers of monthly sales for each month, and finally to find the intersection of each group.
SPL can split complex problems and calculate the final results step by step.
SPL codes:
A |
|
1 |
=db.query("select * from sales") |
2 |
=A1.select(year(ORDERDATE)==YEAR) |
3 |
=A2.group(month(ORDERDATE)) |
4 |
=A3.(~.group(CLIENT)) |
5 |
=A4.(~.top(-20;sum(AMOUNT))) |
6 |
=A5.(~.new(CLIENT,sum(AMOUNT):MONTH_AMOUNT)) |
7 |
=A6.(~.(CLIENT)) |
8 |
=A7.isect() |
A1:First, read the sales table from the database. The sales data of 2015 are extracted and grouped by month.
A2:=A1.select(year(ORDERDATE)==YEAR)
Extract data from sales data for a specified year. Here YEAR is a grid parameter, such as YEAR = 2015.
Note: The filtering in A2 can also be done by SQL.
A3:=A2.group(month(ORDERDATE))
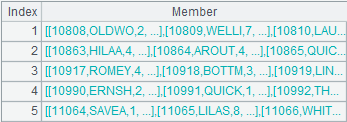
Using the group function, the data for 2015 are grouped by month. SPL data grouping is a real grouping, which divides data into multiple groups according to need. This is different from the case in SQL, where the group by command directly calculates the aggregate value of the grouping, rather than retaining the intermediate result of the grouping. After grouping, the data in A3 are as follows:

We can view the detailed data by double-clicking. Here's the March data:

In order to calculate the total monthly sales of each customer in each month, it is necessary to group by customer again. In SPL, you only need to loop the monthly data, grouping by customer respectively. A.(x) can be used to execute the members of the loop group without having to write the loop code.
A4:=A3.(~.group(CLIENT))
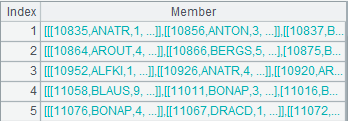
After grouping again, in A4, the monthly data is grouped into groups:

The data grouped by customer in March is as follows:

As you can see, every grouping in March data is the transaction data of a customer.
Note that "~" in the above code represents each member of the group. The code written for "~" is the intra-group operation code, such as ~.group(CLIENT).
Next, continue to calculate the top 20 customers per month through intra-group computing.
A5:=A4.(~.top(-20;sum(AMOUNT)))
A6:=A5.(~.new(CLIENT,sum(AMOUNT):MONTH_AMOUNT))
In A5, the top function is used to calculate the top 20 customers with the largest monthly sales by looping the monthly data. The names and monthly sales of these customers are listed in A6. The results calculated in A6 and the statistics for March are as follows:

Finally, list the Client field in the grouping and find the intersection of each grouping.
A7:=A6.(~.(CLIENT))
A8:=A7.isect()
List the top 20 customer names in A7. Finally, the customer name intersection of 12 months is obtained in A8, and the results are as follows:

From this problem, we can see that SPL can easily implement the intra-group computation of structured data, which can make the idea of solving the problem more intuitive. In the group, it is also easy to complete the re-grouping, sorting and other calculations, so that the data processing in each step is more clear and natural. In addition, SPL can simplify the calculation of group members' loop or intersection, and greatly reduce the amount of code.
In addition to exporting data, SPL can also be directly invoked by reporting tools or Java programs. The method of invoking SPL is similar to that of ordinary database. The JDBC interface provided by SPL can return the results of calculation in the form of ResultSet to the Java main program. Specific methods can refer to relevant documents. 【How to call an SPL script in Java】
SPL Official Website 👉 https://www.scudata.com
SPL Feedback and Help 👉 https://www.reddit.com/r/esProcSPL
SPL Learning Material 👉 https://c.scudata.com
SPL Source Code and Package 👉 https://github.com/SPLWare/esProc
Discord 👉 https://discord.gg/2bkGwqTj
Youtube 👉 https://www.youtube.com/@esProc_SPL


