Group by Segments
【Question】
My Data looks like this:
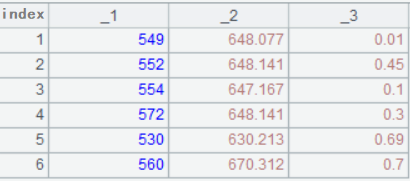
549 648.077 0.01
552 648.141 0.45
554 647.167 0.1
572 648.141 0.3
530 630.213 0.69
560 670.312 0.70
There are a few thousand lines in the file. The 1strow values range from 0-1100. The 2ndrow values range from 600-700. The 3rdrow values range from 0-1 I need to plot the data and therefore need to sort and modify it.
I need to split the 3rd row values (normal range 0.0-1.0) into segments 0.0-0.20, 0.21-0.40, 0, 41-0, 60, 0.61-0.80, 0.81-1.00
Next I need to split the segments from the 1strow (normal range (0-1100) into segments like 0-10, 11-20, 21-30and so on up to 1100. What I want to do is to find all 2nd row values within ranges of 0.0-0.20 and 0-10, 0.0-0.20 and 11-20, 0.0-0.20 and 21-30.
Then I want to add them all together and divide the result by the number of appearances to get the mean value. So I want one value for ranges of 0.0-0.20 and 0-10 respectively. I'm fairly new to Python and here’s my approach:
import os
import csv
dataList = []
with open("table.csv") as csv_file:
data_reader = csv.reader(csv_file, dialect='excel-tab')
for rows in data_reader:
if float(rows[2]) <= 0.20:
if float(rows[0]) <= 10:
print(rows)
if 10 <float(rows[0])<=20:
print (rows)
That should work (without the print of course) to get the values, repeated then for if 20<float(rows[2])<= 0.40: ..... That should bring me the values I want but is there an easy way to set a range going from 0-1100 in 10 units step?
P.S.: I am aware that I gave lots of Info for a relative short question and that's because I don't really know if Python is the best way to do this and if my approach is reasonable. Maybe I should go with Panda but I just installed that. So in case anyone knows an easier (maybe not coding related) way to solve a problem like this I'd really appreciate it.
【Answer】
This is simple grouping and aggregation. But the special thing about your case is that we need to group records by the specified ranges rather than by the related fields directly. Take 3rd for example, we can set the conditional range like this: 3*100\20, and then group its values by the integer part. This way 0.1 and 0.15 will be included in the range of 0-0.2.
Python only gives limited support for structured computation. The code will be really complicated. So here I choose to phrase the algorithm in SPL (Structured Process Language):
| A |
|
| 1 |
=file("d:\\souce.txt").import() |
| 2 |
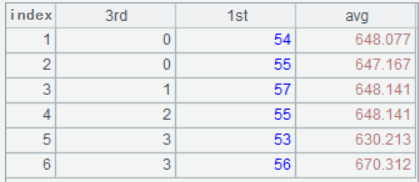
=A1.group(#3*100\20:3rd,#1\10:1st;~.avg(#2):avg) |
| 3 |
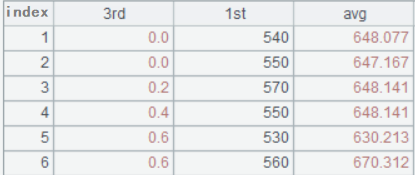
=A2.run(3rd=3rd*20/100,1st=1st*10) |
A1: Read in the contents of source.txt.

A2: Set the conditional range for 3rd column and 1st column respectively, group records and calculate average. The group numbers displayed for 3rd are 0, 1, 2....

A3: Convert group numbers into actual ranges 0, 0.2, 0.4.

SPL Official Website 👉 https://www.scudata.com
SPL Feedback and Help 👉 https://www.reddit.com/r/esProc_SPL
SPL Learning Material 👉 https://c.scudata.com
SPL Source Code and Package 👉 https://github.com/SPLWare/esProc
Discord 👉 https://discord.gg/cFTcUNs7
Youtube 👉 https://www.youtube.com/@esProc_SPL


