How to realize X-axis dynamic grouping according to parameters in BIRT statistical chart
Key words: dynamic grouping BIRT statistical chart displays different columns according to different conditions
Reporting tools are generally good at dealing with data with consistent rules. Dynamic operation with inconsistent conditions is difficult to achieve in the report. It is a common practice to write a program to prepare the data source, and then pass it to BIRT for presentation, instead of directly processing such data in BIRT.
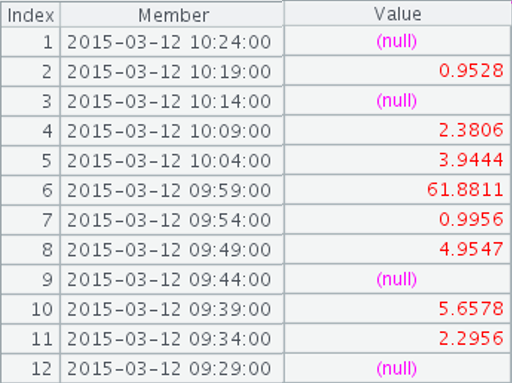
For example, to deal with such a scenario: the x-axis of the statistical chart is time scaled, and different values are displayed according to different parameter conditions. Count 1 hour, one item every 5 minutes, and generate 12 items. Expected results:

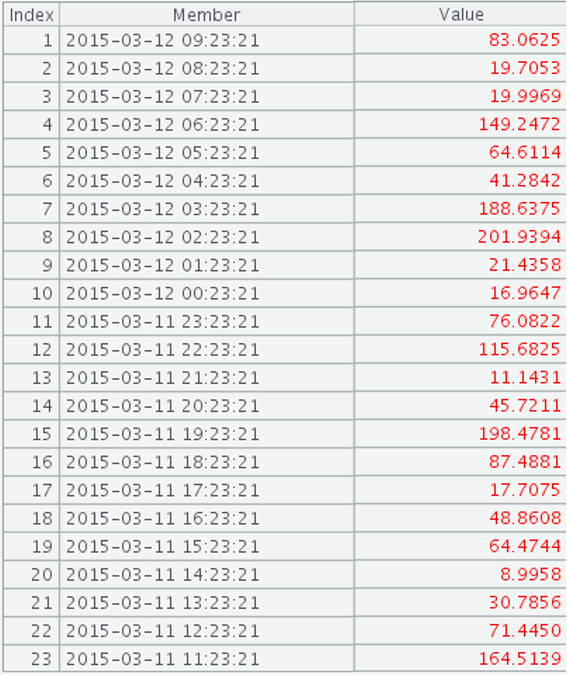
Count 1 day, 1 item per hour, and generate 24 items. Expected results:

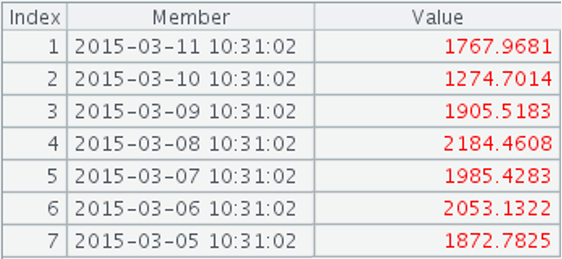
Count one week, one item a day, and generate 7 items. Expected results:

You can use the API provided by BIRT to modify the x-axis scale. The code should be written as follows:
... function beforeGeneration( chart, icsc ) { //01 hour 02 day 03 week var type = icsc.getExternalContext().getScriptable().getParameterValue("type"); ... var xAxisArray = chart.getAxes(); xAxisArray[0].setCategoryAxis(false); if(type=='01'){ xAxisArray[0].getScale().setUnit(xAxisArray[0].getScale().getUnit().MINUTES_LITERAL); xAxisArray[0].getScale().setStep(5); }else if(type=='02'){ xAxisArray[0].getScale().setUnit(xAxisArray[0].getScale().getUnit().HOURS_LITERAL); xAxisArray[0].getScale().setStep(1); } else { xAxisArray[0].getScale().setUnit(xAxisArray[0].getScale().getUnit().DAYS_LITERAL); xAxisArray[0].getScale().setStep(1); } } ... |
It is recommended to use esProc. Its rich set operations can easily complete such calculations, which is much shorter than the code written in Java. For example, similar calculations can be written in esProc as follows (assuming that the data table is tv, where the occurrence time column is t, and the statistical value column is v):
A |
B |
|
1 |
=[] |
|
2 |
if(type==“hour”) |
>A1=12.(elapse@s(now(),-5*60*~)) |
3 |
else if(type==“day”) |
>A1=24.(elapse@s(now(),-60*60*~)) |
4 |
else if(type==“week”) |
>A1=7.(elapse(now(),-~)) |
5 |
=A1.(demo.query(“select sum(v) from tv where t>? and t<=?”,~, ifn(~[-1],now()))).new(~.v:Value) |
|
The start and end time series are calculated by the receiving parameter (type), and then the summary statistics are performed by SQL according to the start and end time periods to get the summary results in each time period. Finally, the whole result set is returned to BIRT, which can be presented by the method of general statistical chart.
In fact, there are many similar calculation problems that are not convenient, but it is very simple with the help of esProc SPL. You can refer to: Some examples of solving BIRT dynamic data source
esProc provides JDBC driver, and can be easily integrated with BIRT and other reporting tools. Please refer to How to Call an SPL Script in BIRT.
For esProc installation, free authorization and related technical information, please refer to Getting started with esProc
SPL Official Website 👉 https://www.scudata.com
SPL Feedback and Help 👉 https://www.reddit.com/r/esProcSPL
SPL Learning Material 👉 https://c.scudata.com
SPL Source Code and Package 👉 https://github.com/SPLWare/esProc
Discord 👉 https://discord.gg/2bkGwqTj
Youtube 👉 https://www.youtube.com/@esProc_SPL


