How to use SQL query on data in Excel
Excel provides built-in query functions such as Filter, Pivot Table, and Subtotal, but these operations are sometimes cumbersome and not flexible enough. For some people with SQL experience, it would be much more convenient if they can query data directly with SQL.
For example, the following sales order table:
A |
B |
C |
D |
E |
|
1 |
sales 2009-2013 |
||||
2 |
OrderID |
Client |
SellerId |
Amount |
OrderDate |
3 |
26 |
TAS |
1 |
2142.4 |
2009-08-05 |
4 |
33 |
DSGC |
1 |
613.2 |
2009-08-14 |
5 |
84 |
GC |
1 |
88.5 |
2009-10-16 |
6 |
133 |
HU |
1 |
1419.8 |
2010-12-12 |
7 |
32 |
JFS |
3 |
468 |
2009-08-13 |
8 |
39 |
NR |
3 |
3016 |
2010-08-21 |
9 |
43 |
KT |
3 |
2169 |
2009-08-27 |
10 |
71 |
JFE |
3 |
240.4 |
2010-10-01 |
11 |
99 |
RA |
3 |
1731.2 |
2009-11-05 |
12 |
… |
… |
4 |
4031 |
2010-07-29 |
Goal: Find the number of orders for each sales (column C) in 2009, and post the results in columns G to H. As shown below:
A |
B |
C |
D |
E |
F |
G |
H |
|
1 |
sales 2009-2013 |
|||||||
2 |
OrderID |
Client |
SellerId |
Amount |
OrderDate |
sellerid |
orderNum |
|
3 |
26 |
TAS |
1 |
2142.4 |
2009-08-05 |
1 |
3 |
|
4 |
33 |
DSGC |
1 |
613.2 |
2009-08-14 |
3 |
3 |
|
5 |
84 |
GC |
1 |
88.5 |
2009-10-16 |
… |
… |
|
6 |
133 |
HU |
1 |
1419.8 |
2010-12-12 |
|||
7 |
32 |
JFS |
3 |
468 |
2009-08-13 |
|||
8 |
39 |
NR |
3 |
3016 |
2010-08-21 |
|||
9 |
43 |
KT |
3 |
2169 |
2009-08-27 |
|||
10 |
71 |
JFE |
3 |
240.4 |
2010-10-01 |
|||
11 |
99 |
RA |
3 |
1731.2 |
2009-11-05 |
|||
12 |
… |
… |
4 |
4031 |
2010-07-29 |
|||
If you use SQL, it is just one sentence: select sellerid,count (1) orderNum from table_name where year( OrderDate )=2009 group by sellerid , very simple.
Let's look at how to use SQL to query and calculate data in Excel.
1. Download esProc DSK Edition and install it. Find it on the official website
Note that you must download the license at the same time. The free version is enough. After installation, you will be prompted to load authorization.
2. Use Excel to open the file that needs to be calculated, such as the example above.
3. Select the A2:E12 area and press ctrl+C to copy to the clipboard.
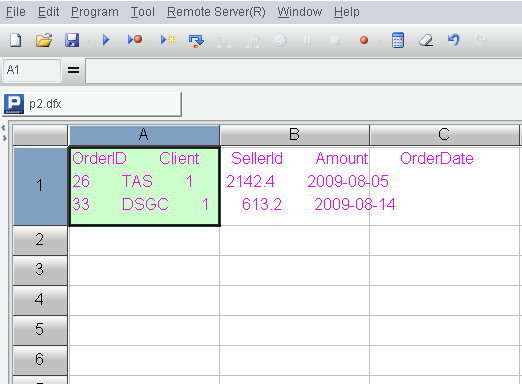
4. Switch to esProc, select cell A1, and make sure to place the cursor in the editing state of A1, and use ctrl+V to paste the data into cell A1.
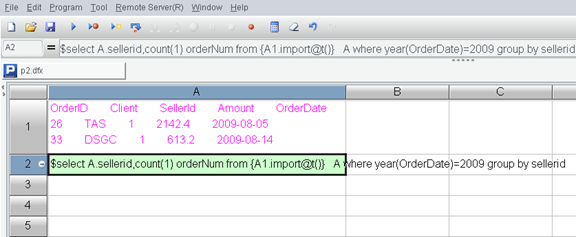
5. Fill in the SQL statement in cell A2 of esProc: $select sellerid,count (1) orderNum from {A1.import@t()} where year( OrderDate )=2009 group by sellerid , note that there must be a $ symbol, which is the specification for esProc to directly call SQL, from content to write to {A1.import@t ()}, where A1 represents the text to tabular data in order to perform SQL, @ t represents the first line is the column name.
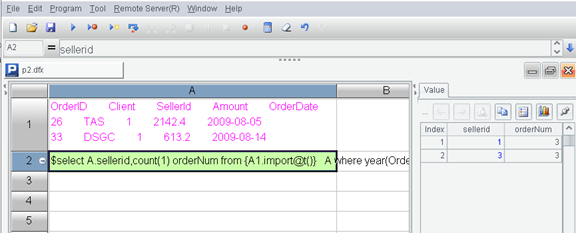
6. Press F9 to execute, then click A2. You can see the execution result on the right.
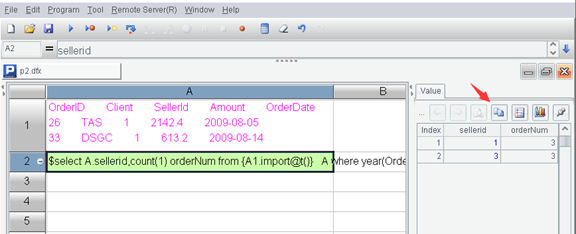
7. Hold down shift (to bring the column name) and click the "copy data" button on the right to copy the calculation result of A2 to the clipboard.
8. In the G2 cell of Excel, paste the result with ctrl+V.
OK, you're done.
Give another example of correlation calculation. For example, Excel has two sheets, orders, and employee, and now the two sheets should be combined together.
See the example above for the first two steps.
3. Select the column name and data in the orders sheet, Ctrl+C to copy to the clipboard, Ctrl+V to paste to cell A1 of esProc.
4. Similarly, copy and paste the employee sheet to cell B1 of esProc.
5. Execute SQL in cell A2: $select o.OrderID , o.OrderDate,o.Amount , e.Name , e.Dept from {A1.import@t()} o left join {B1.import@t() } e on o.sellerID = e.empID
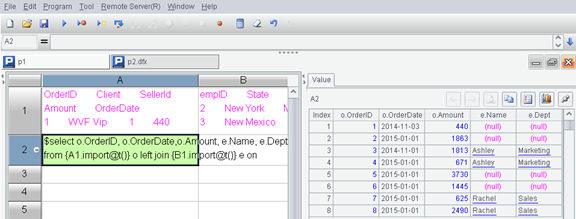
See the example above for the next steps.
esProc can support most of the syntax and functions of the SQL92 standard, including nested subqueries and even WITH.
SPL Official Website 👉 https://www.scudata.com
SPL Feedback and Help 👉 https://www.reddit.com/r/esProc_Desktop/
SPL Learning Material 👉 https://c.scudata.com
Discord 👉 https://discord.gg/cFTcUNs7
Youtube 👉 https://www.youtube.com/@esProcDesktop
Linkedin Group 👉 https://www.linkedin.com/groups/14419406/


