Generate Calculated Columns Based on the Aggregation Results
Examples
Example1
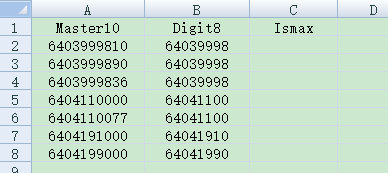
The Excel file book1.xlsx has three columns, as shown in the figure below, in which Master10 is 10-digit numbers, and Digit8 is the first eight digits of Master10.

The task is to calculate the value of Ismax column following the rule that: classify the data according to Digit8; if Master10 is the maximum value in the category, the value of Ismax is Master10; otherwise, the value is Nil.
Write SPL script:
A |
|
1 |
=T("e:/work/book1.xlsx") |
2 |
=A1.group(Digit8).run(a=~.max(Master10),~.run(Ismax=if(Master10==a,Master10,"Nil"))) |
3 |
=T("e:/work/book2.xlsx",A1) |
A1 Read the data of book1.xlsx
A2 Group the data by Digit8, and then loop through each group. First, calculate the maximum value “a” of Master10 in the group, and then loop through each record in the group. If Master10=a in this record, set Ismax=Master10, otherwise Ismax=”Nil”
A3 Store the results in A1 to book2.xlsx
Example2
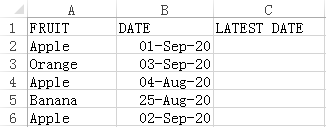
There is an Excel file book1.xlsx as shown below:

The original data is out of order. We need to find a record with the latest date (DATE) in each group (FRUIT), mark it as TRUE, and mark the others as FALSE. The results are as follows:

Write SPL script:
A |
|
1 |
=T("e:/work/book1.xlsx") |
2 |
=A1.group(FRUIT).run(a=~.max(DATE),~.run(‘LATEST DATE’=if(DATE==a, "TRUE","FALSE"))) |
3 |
=T("e:/work/book2.xlsx",A1) |
A1 Read the data of book1.xlsx
A2 Group the data by FRUIT, and then loop each group. First, calculate the maximum value “a” of DATE in the group, and then loop each record in the group. If DATE=a in this record, set LATEST DATE=TRUE, otherwise LATEST DATE=FALSE
A3 Store the results in A1 to book2.xlsx
SPL Official Website 👉 https://www.scudata.com
SPL Feedback and Help 👉 https://www.reddit.com/r/esProc_Desktop/
SPL Learning Material 👉 https://c.scudata.com
Discord 👉 https://discord.gg/2bkGwqTj
Youtube 👉 https://www.youtube.com/@esProcDesktop
Linkedin Group 👉 https://www.linkedin.com/groups/14419406/


