Looking for the Best External Analytic Technique for Salesforce
【Abstract】
Sometimes the target report you are building is not supported by SFDC. You need to perform further analytics and build the report outside Salesforce. This essay compares four types of analytic data techniques to examine their abilities from several aspects and finds out that SPL, with its powerful computing ability, high real-time, simple computing architecture, economic development process and easy to use JDBC interface, is the most outstanding one.
SalesForce.com (SFDC) cannot provide corresponding report templates for all common computing scenarios. So sometimes we need to retrieve data from the data source, analyze it using another technique and build the desired report outside the service platform. SFDC provides two standard data retrieval interfaces, restful json and soap xml, and there are a wealth of mature reporting tools for our selection. So, there are no big issues about interfaces and report development tools. The key and hardest part is to choose the most appropriate one among the various and different techniques for further analytics.
It is natural to use a high-level language, C# or JAVA, for instance, to do the further analytics through programming. The problem is that a programming language lacks related computing class libraries and uses hardcoding instead to achieve all details. The hardcoding involves a huge amount of work, requires great skills, and is difficult to maintain. It is rare to use in real-world situations. There are three most commonly used techniques, and we will look at them one by one.
Reporting tool analytics module
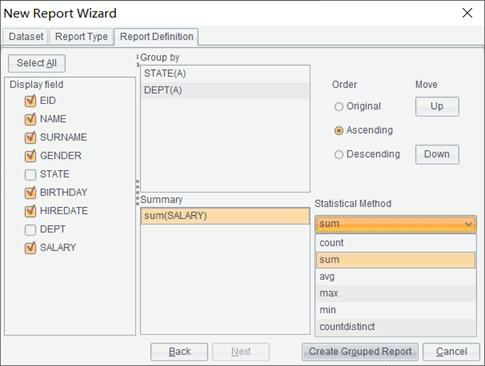
The analytic process is usually done within the report data source, but sometimes a further analysis needs to be performed within the report. Displaying detailed data as well as the aggregate values in one report, and first joining an SFDC object and an Oracle table and then displaying data are two instances. In these cases, we need to make analysis using the reporting tool’s analytics module. Below is a common analytics module:

A few reporting tools, such as tableau, IBM cognos and Microsoft power BI, have built-in restful json interface or soap interface to access SFDC directly. Excel2019 also provides built-in model to access SFDC for building one-off (non-programmable) reports of fixed layout. The interface can be independently encapsulated as a JDBC\ODBC driver for the use a reporting tool that cannot support SFDC directly. A commercial driver, such as that of IBM, informatica or jdata, or an open-source project, such as ascendix and salesforce-jdbc,
The biggest merit of an analytics module is that it is convenient and easy to use. Its style of operation, the intuitive drag-and-drop or user-friendly wizard, is what the business people have been accustomed to.
The analytics module’s demerit is prominent, too. It has, compared with SQL, far weaker computing ability that can only handle simple computations, including sorting, filtering, grouping, aggregation, and getting computed column. There are a lot of computations that it cannot manage, such as subqueries (from(SQL)), temporary table (with) and window functions (over).
Into-database SQL analytics
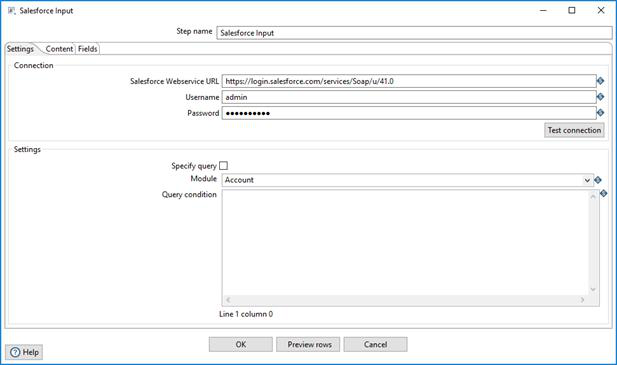
SQL has more computing strengths than reporting tools. We, sometimes, load the SDFC data into the database and perform data analytics using SQL. Below is a common data input window:

If you have special requirements for batch processing and visualization, you can load data using ETL tools, like informatica, datastage and kettle. If you want to reduce cost, you can do the data loading using SFDC driver plus programming.
SQL’s advantage is the great computing capacity for achieving subqueries, temporary tables and window functions easily, and most data analytic algorithms report development needs.
Performing SQL analytics in the database cannot ensure real-timeness, which is vital for certain projects. Loading data with an ETL tool leads to complex and heavy architecture, which brings more trouble when considering the report development target. It is too expensive to load data to the database using programing plus driver, much more expensive than report building itself.
Python
Compared with SQL, Python boasts equal, sometimes even stronger, computing ability thanks to its built-in structured computing class libraries. The language also provides a special data retrieval interface, linking retrieval from SFDS and further data analytics into a coherent and smooth process. This avoids the disadvantages of database loading, gets high real-time, creates light and simple architecture, and controls development cost within a reasonable range.
Python’s sources of abilities are various third-party class libraries. Pandas supplies structured computing ability and Beatbox (more commonly used) or simple-salesforce provides ability to access SFDC. The following code retrieves certain data from the SFDC built-in Lead table and converts it to structured object DataFrame:
import beatbox

import pandas as pd

sf_username = "your name"

sf_password = "your password"

sf_api_token = "your token"

sf_client = beatbox.PythonClient()

password = str("%s%s" % (sf_password,   sf_api_token))

sf_client.login(sf_username, password)

lead_qry = "SELECT Name, Country, CreatedDate   FROM Lead limit 5"

query_result = sf_client.query(lead_qry)

records = query_result['records']

df = pd.DataFrame(records)
It is easy to achieve common computations using DataFrame:
df.query('salary>8000 and salary<10000')                            #Filtering

df.sort_values(by="salary",ascending =True)                         #Sorting

df.groupby("deptid")\['salary'\].agg(\[len,np.sum, np.mean\])      #Grouping & aggregation
Pandas has an equal, sometimes even better, structured computing ability than SQL. It can handle complicated computations. The following DataFrame duty stores daily duty information:
Date |
name |
2018-03-01 |
Emily |
2018-03-02 |
Emily |
2018-03-04 |
Emily |
2018-03-04 |
Johnson |
2018-04-05 |
Ashley |
2018-03-06 |
Emily |
2018-03-07 |
Emily |
… |
… |
One will be on duty for several workdays continuously before another one takes their turn. Now we are trying to get the continuous duty information for each person. Below shows part of the desired result set:
name |
begin |
end |
Emily |
2018-03-01 |
2018-03-03 |
Johnson |
2018-03-04 |
2018-03-04 |
Ashley |
2018-03-05 |
2018-03-05 |
Emily |
2018-03-06 |
2018-03-07 |
… |
… |
… |
Here is the core code for achieving the above the computing task:
# Skip the code of getting data from_duty_

name_rec = ''

start = 0

duty_list = \[\]

for i in range(len(duty)):

    if name_rec == '':

        name_rec   = duty\['name'\]\[i\]

    if name_rec != duty\['name'\]\[i\]:

        begin =   duty\['date'\].loc\[start:i-1\].values\[0\]

        end =   duty\['date'\].loc\[start:i-1\].values\[-1\]

        duty\_list.append(\[name\_rec,begin,end\])

        start = i

        name_rec   = duty\['name'\]\[i\]

begin = duty\['date'\].loc\[start:i\].values\[0\]

end = duty\['date'\].loc\[start:i\].values\[-1\]

duty\_list.append(\[name\_rec,begin,end\])

duty\_b\_e = pd.DataFrame(duty_list,columns=\['name','begin','end'\])
Both Python’s merit and demerit are obvious. The language does not have a convenient interface to be integrated in reporting tools. As nearly all reporting tools are Java- or .net-based, JDBC or ODBC is the most convenient interface followed by Java or the user-defined data set written in C#. The problem is that both types of interfaces are not offered in Python. Though there are some ways (like PyObject) of calling a Python script indirectly using a user-defined data set, they are not as mature and stable as expected and thus are rare to use.
esProc SPL
Like Python, SPL is an open-source data computing language, yet with built-in interface for accessing SFDC and a rich variety of class libraries for structured data computations. To query certain data in Lead table, for instance, SPL has the following code:
A |
|
1 |
=sf_open("D:\\raqsoft64\\extlib\\SalesforceCli\\user.json") |
2 |
=sf_query(A1,"/services/data/v51.0/query","SELECT Name, Country, CreatedDate FROM Lead limit 5") |
3 |
=sf_close(A1) |
user.json stores salesforce account information (such as username, password, api_token). A2 creates a SPL structured data object table sequence, making the extra conversion action in Python unnecessary. You can perform all common operations on a table sequence:
A |
B |
|
4 |
=A2.select(salary>8000 && salary<10000) |
/Filtering |
5 |
=A2.sort(salary) |
/Sorting |
6 |
=A2.groups(deptid;sum(salary),avg(salary)) |
/Grouping & aggregation |
SPL possesses powerful structured computing capacity, enabling it to deal with complicated computations effortlessly. To get each person’s continuous duty information based on table sequence duty, for instance, SPL uses the following code:
A |
|
1 |
// Skip code for getting data from duty table |
2 |
=duty.group@o(name) |
3 |
=A2.new(name,~.m(1).date:begin,~.m(-1).date:end) |
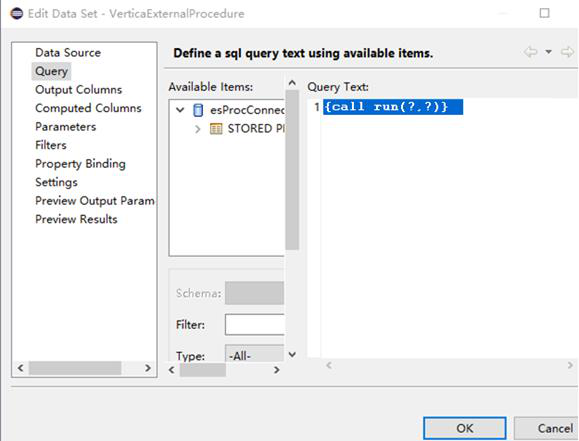
SPL’s another strength is its built-in JDBC\ODBC interface for being conveniently integrated by various reporting tools. By saving a piece of SPL code as a script file, say run.dfx, you can call it in a reporting tool in the way of calling the stored procedure. Take BIRT as an example:

In a nutshell, among the above mentioned external analytic techniques for Salesforce, Python and SPL have much greater computing capacity than reporting tools, provide higher real-time than into-database SQL, have simple architectures, and are cost-effective. Most importantly, SPL is more integration-friendly to reporting tools by offering JDBC\ODBC interface.
SPL Official Website 👉 https://www.scudata.com
SPL Feedback and Help 👉 https://www.reddit.com/r/esProcSPL
SPL Learning Material 👉 https://c.scudata.com
SPL Source Code and Package 👉 https://github.com/SPLWare/esProc
Discord 👉 https://discord.gg/2bkGwqTj
Youtube 👉 https://www.youtube.com/@esProc_SPL


Chinese version