Group and summarize rows while retaining columns whose values are unchanged
In the Excel table below, ID column is the category; Value1 and Value2 contain numbers; both Descr 1 and Descr 2 maintain unchanged under the same ID value.
A |
B |
C |
D |
E |
|
1 |
ID |
Value 1 |
Value 2 |
Descr 1 |
Descr 2 |
2 |
11 |
2.5 |
1.8 |
a |
x1 |
3 |
11 |
2.3 |
1.1 |
a |
x1 |
4 |
11 |
1.9 |
1.6 |
a |
x1 |
5 |
12 |
3.7 |
3.5 |
b |
x2 |
6 |
12 |
3.9 |
1.5 |
b |
x2 |
7 |
13 |
2.5 |
0.2 |
c |
x3 |
8 |
13 |
2.6 |
4.1 |
c |
x3 |
9 |
13 |
2 |
4.8 |
c |
x3 |
10 |
13 |
2.7 |
1.8 |
c |
x3 |
This is an older version of Excel (which does not support groupby function). Task: Group rows by ID and sum Value1 field and Value2 field while retaining Descr 1 field and Descr 2 field.
G |
H |
I |
J |
K |
|
1 |
ID |
Value 1 |
Value 2 |
Descr 1 |
Descr 2 |
2 |
11 |
6.7 |
4.5 |
a |
x1 |
3 |
12 |
7.6 |
5 |
b |
x2 |
4 |
13 |
9.8 |
10.9 |
c |
x3 |
Use SPL XLL to get this done:
=spl("=E(?).groups(ID;sum('Value 1'):'Value 1',sum('Value 2'):'Value 2','Descr 1','Descr 2')",A1:E10)
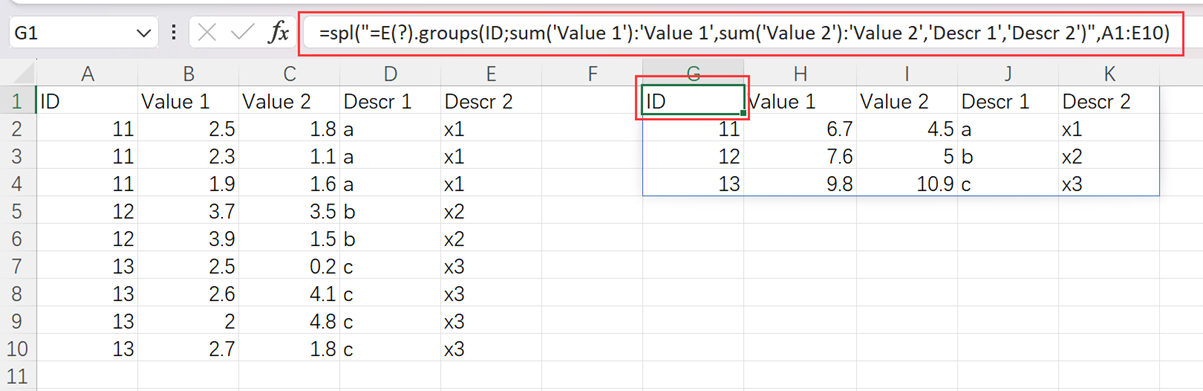
E()function converts a data arrange to a table. groups() function groups and summarizes the table, during which a newly generated column can be renamed through the semicolon.
SPL Official Website 👉 https://www.scudata.com
SPL Feedback and Help 👉 https://www.reddit.com/r/esProc_Desktop/
SPL Learning Material 👉 https://c.scudata.com
Discord 👉 https://discord.gg/2bkGwqTj
Youtube 👉 https://www.youtube.com/@esProcDesktop
Linkedin Group 👉 https://www.linkedin.com/groups/14419406/