Analytic Techniques for Business - Excel to esProc Desktop
Sales personnel are highly skilled at using Excel for routine analysis. However, when data preparation steps become cumbersome, the problems to be solved are relatively complex, and tasks are repetitive, relying solely on Excel’s internal techniques can be quite difficult. The ideal approach is to solve these issues using external programs or tools. If you’ve ever explored and practiced this, you’ll find that popular programming languages or tools often fall short. For example, Python has a high learning curve, is not user-friendly for non-IT professionals, and is not suitable for typical business calculations. Similarly, Power Query, with its graphical interface and M language, is quite effective in the data preparation phase but offers too little in the data analysis phase.
If you’ve encountered such frustrations with data analysis or struggled to find a solution, esProc Desktop is your answer. It is designed for non-professionals, allowing them to perform step-by-step calculations on Excel data using simple, easy-to-use functions and scripts. The calculations are synchronized with the results, and it’s ready to use right out of the box, with convenient debugging. With a little programming experience, you can easily get started. Below, I’ll guide you through a demonstration for a preliminary understanding.
For example, sales management analysts need to understand the sales performance, age, gender, and names of sales personnel nationwide. They want to know: ‘The sales figures for female salespeople under 40 years old this year,’ ‘The top three salespeople in each state this year,’ ‘The sales champion from recent years,’ and ’The top three salespeople in the state for three consecutive years.
Data preparation
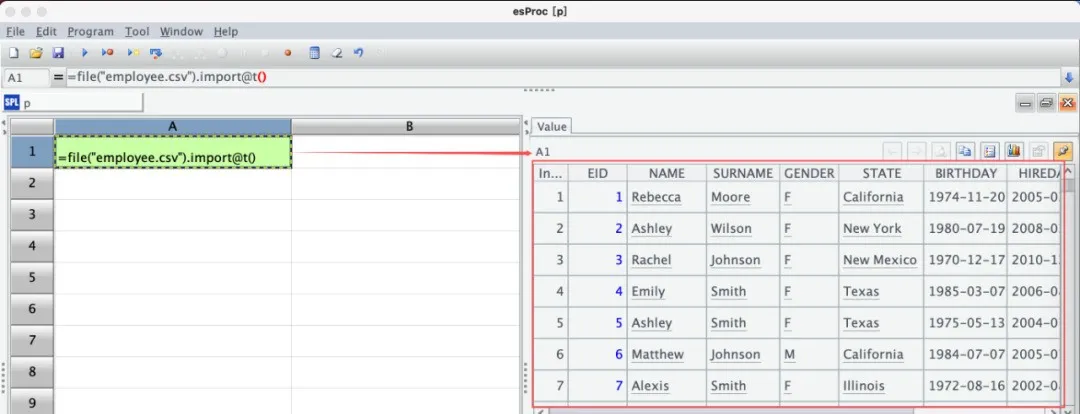
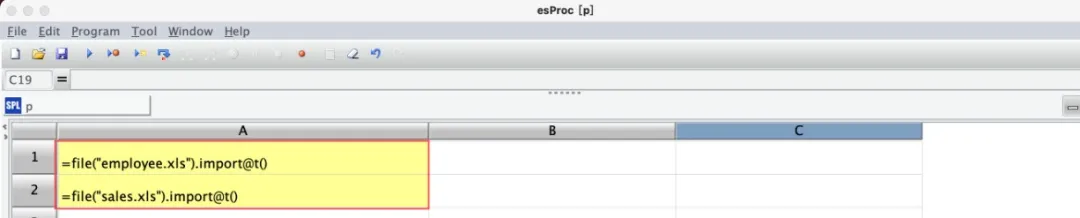
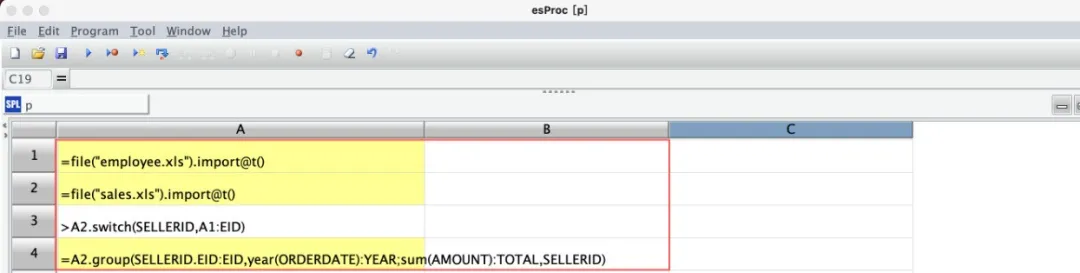
Open esProc Desktop, use the file function along with the file path to locate the data file containing the employee table. Then, use the import function to read the data into cell A1. You will see that the value in A1 has become a data table.
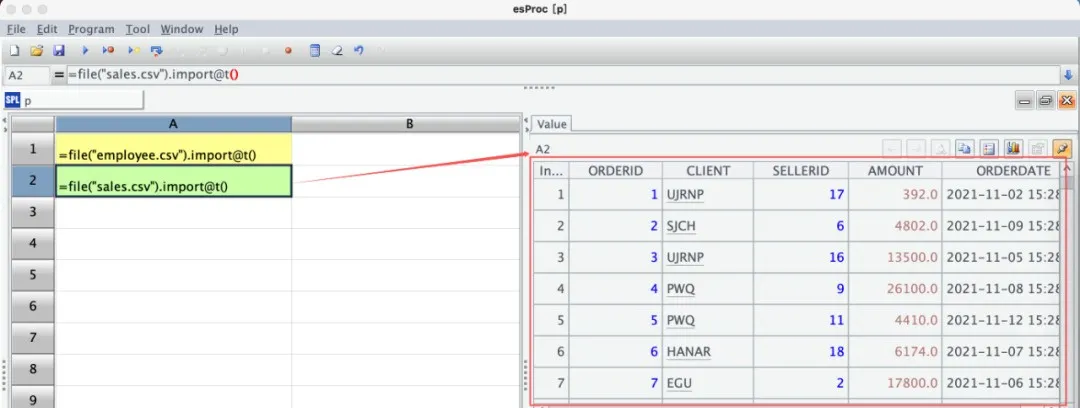
In cell A2, use the same method to read the sales table into the cell.
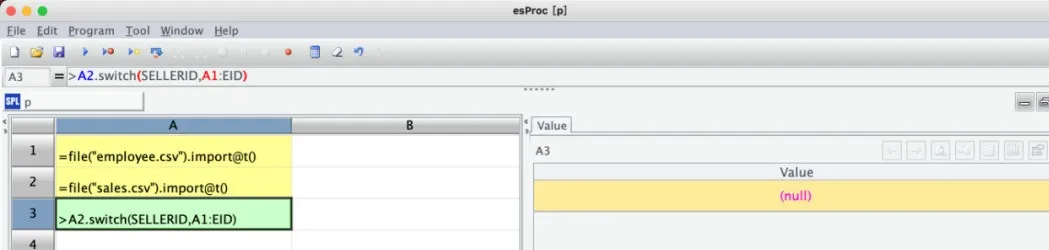
In cell A3, use the switch function to associate the SellerID in the sales table (A2) with the Employee ID in the employee table (A1). This works similarly to the XLOOKUP function in Excel, but with a significant difference: here, the association is made just once, and can be reused multiple times afterward.
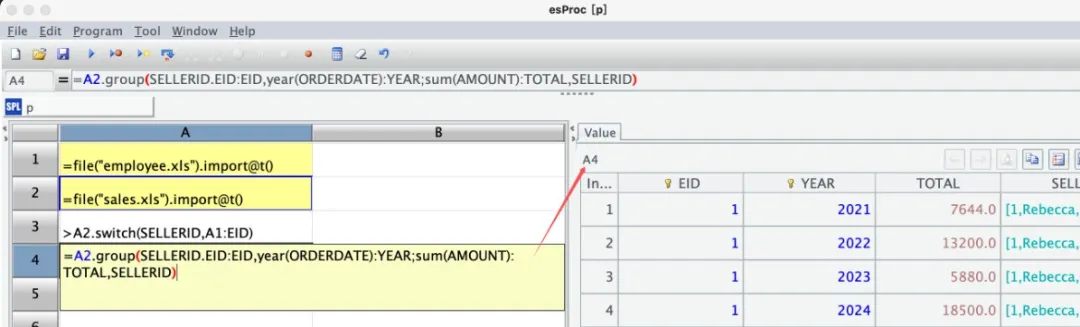
In cell A4, use the associated sales table from A2, where SellerID is now a linked reference field. By using a dot followed by the field name, you can directly access all fields from the employee table. Since the analysis primarily focuses on the sales performance of salespeople, group the sales table (A2) by Employee ID and year to summarize the sales figures for each group, reflecting each salesperson’s sales for the year. Extract the linked reference field SellerID to retain employee information for future use. The resulting table in A4 is a grouped summary table. Thus, the entire data preparation phase is complete.
Data analysis
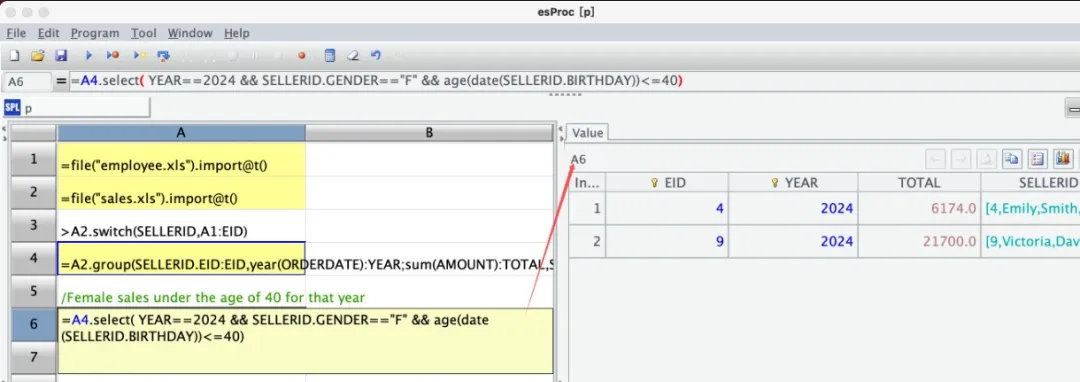
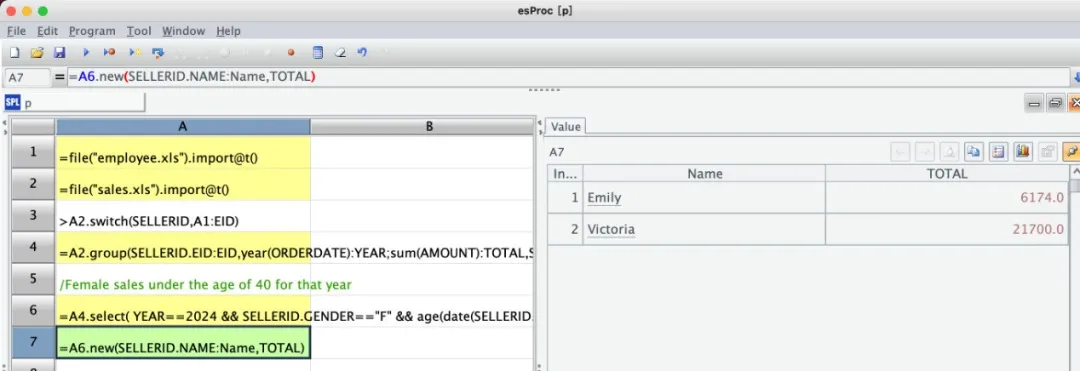
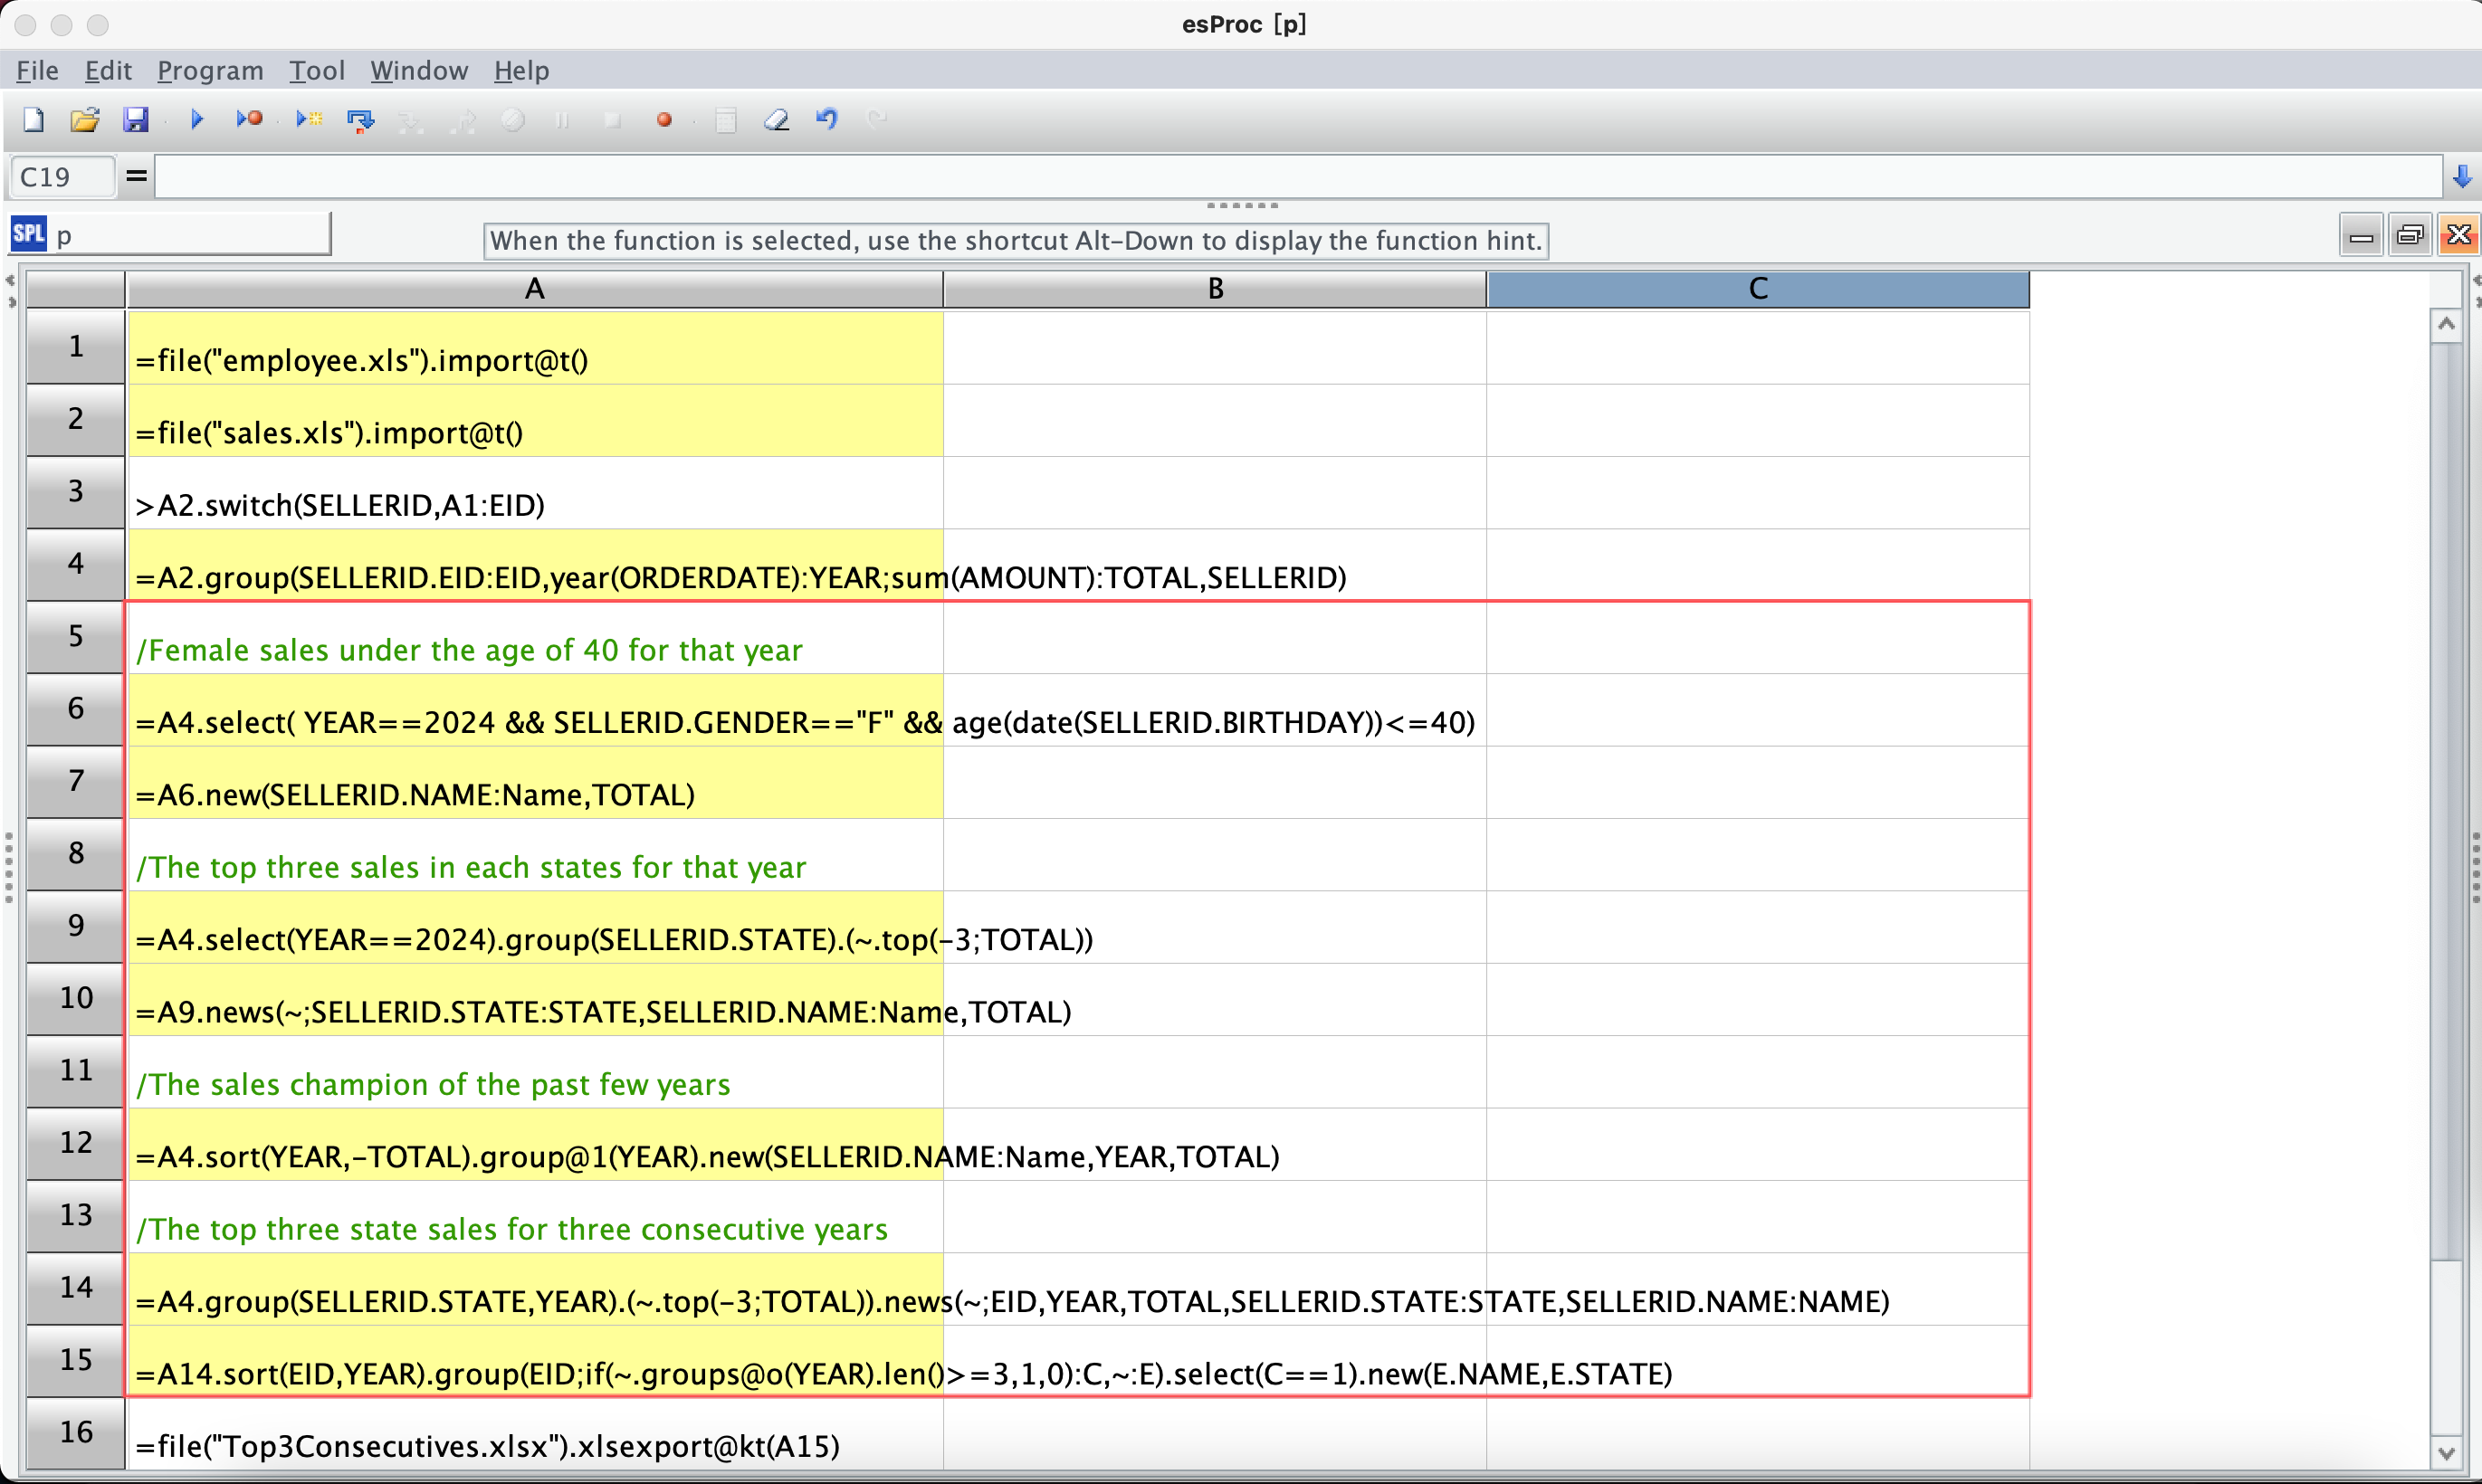
To find ’the sales figures for female salespeople under 40 years old this year,’ simply use the ‘select’ function in cell A6 to filter the grouped summary table in A4 by year, gender, and age. Since the associations were made earlier, you can conveniently access the employee’s GENDER and BIRTHDAY through the linked reference field SellerID. This makes it very convenient, and we will continue to see such usage later. Then, in cell A7, use the ‘new’ function to extract the names and sales figures from the filtered result table in A6.
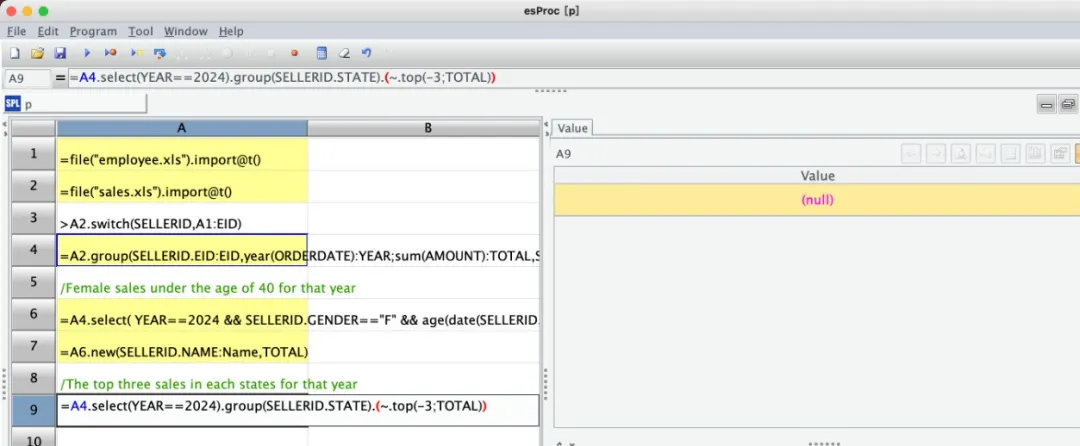
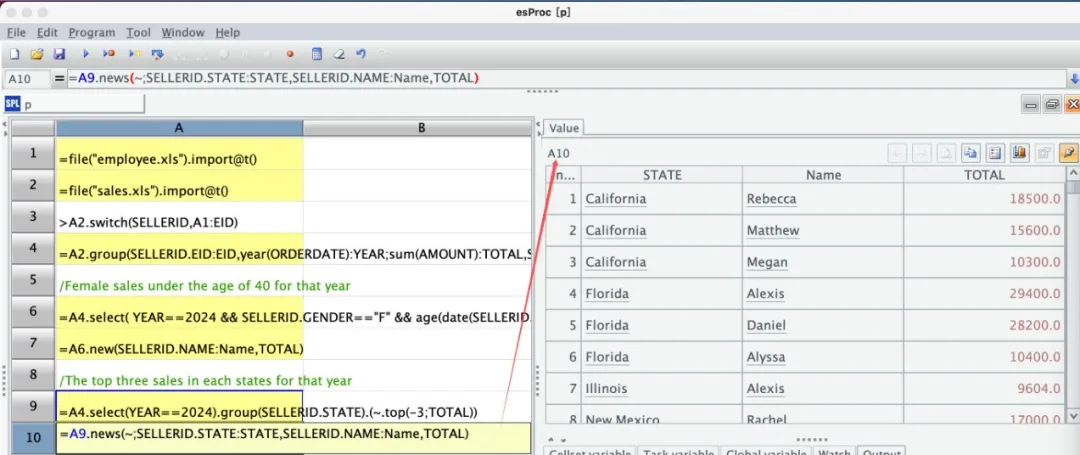
To find ’the top three salespeople in each state this year,’ start by using the ‘select’ function in cell A9 to filter the grouped summary table in A4 by year. Then, group the data by the state of the employees, and finally use the ‘top’ function to find the top three sales figures within each group. In cell A10, use the ‘new’ function to extract the state names, names, and sales figures from each group in A9.
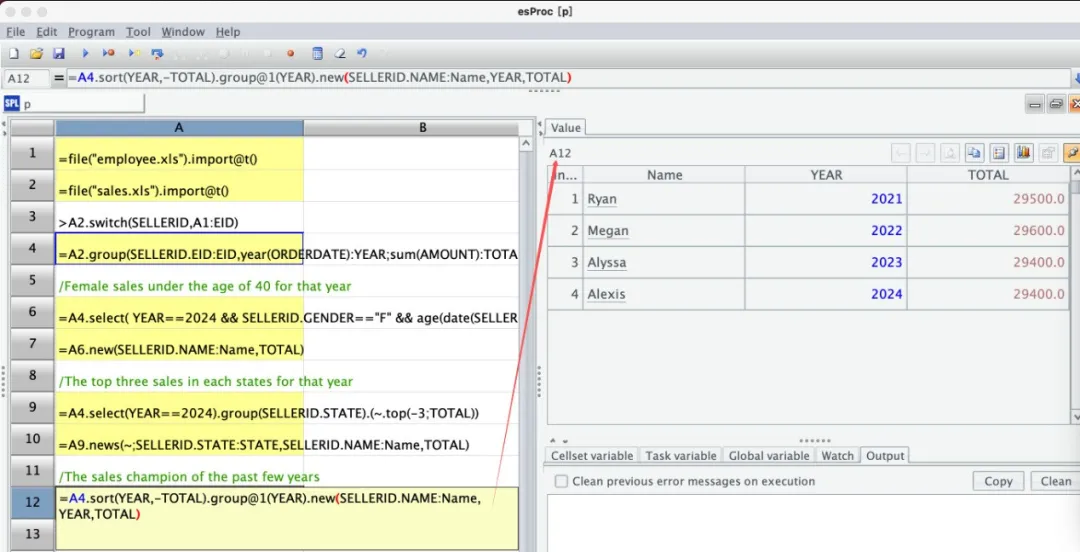
To find ’the sales champion from recent years,’ in cell A12, first sort the data in A4 by year and sales figures in descending order. Then, group the data by year. The @1 is a function option that means to take the first record from each group. After that, use the new function to extract the desired field values from the records.
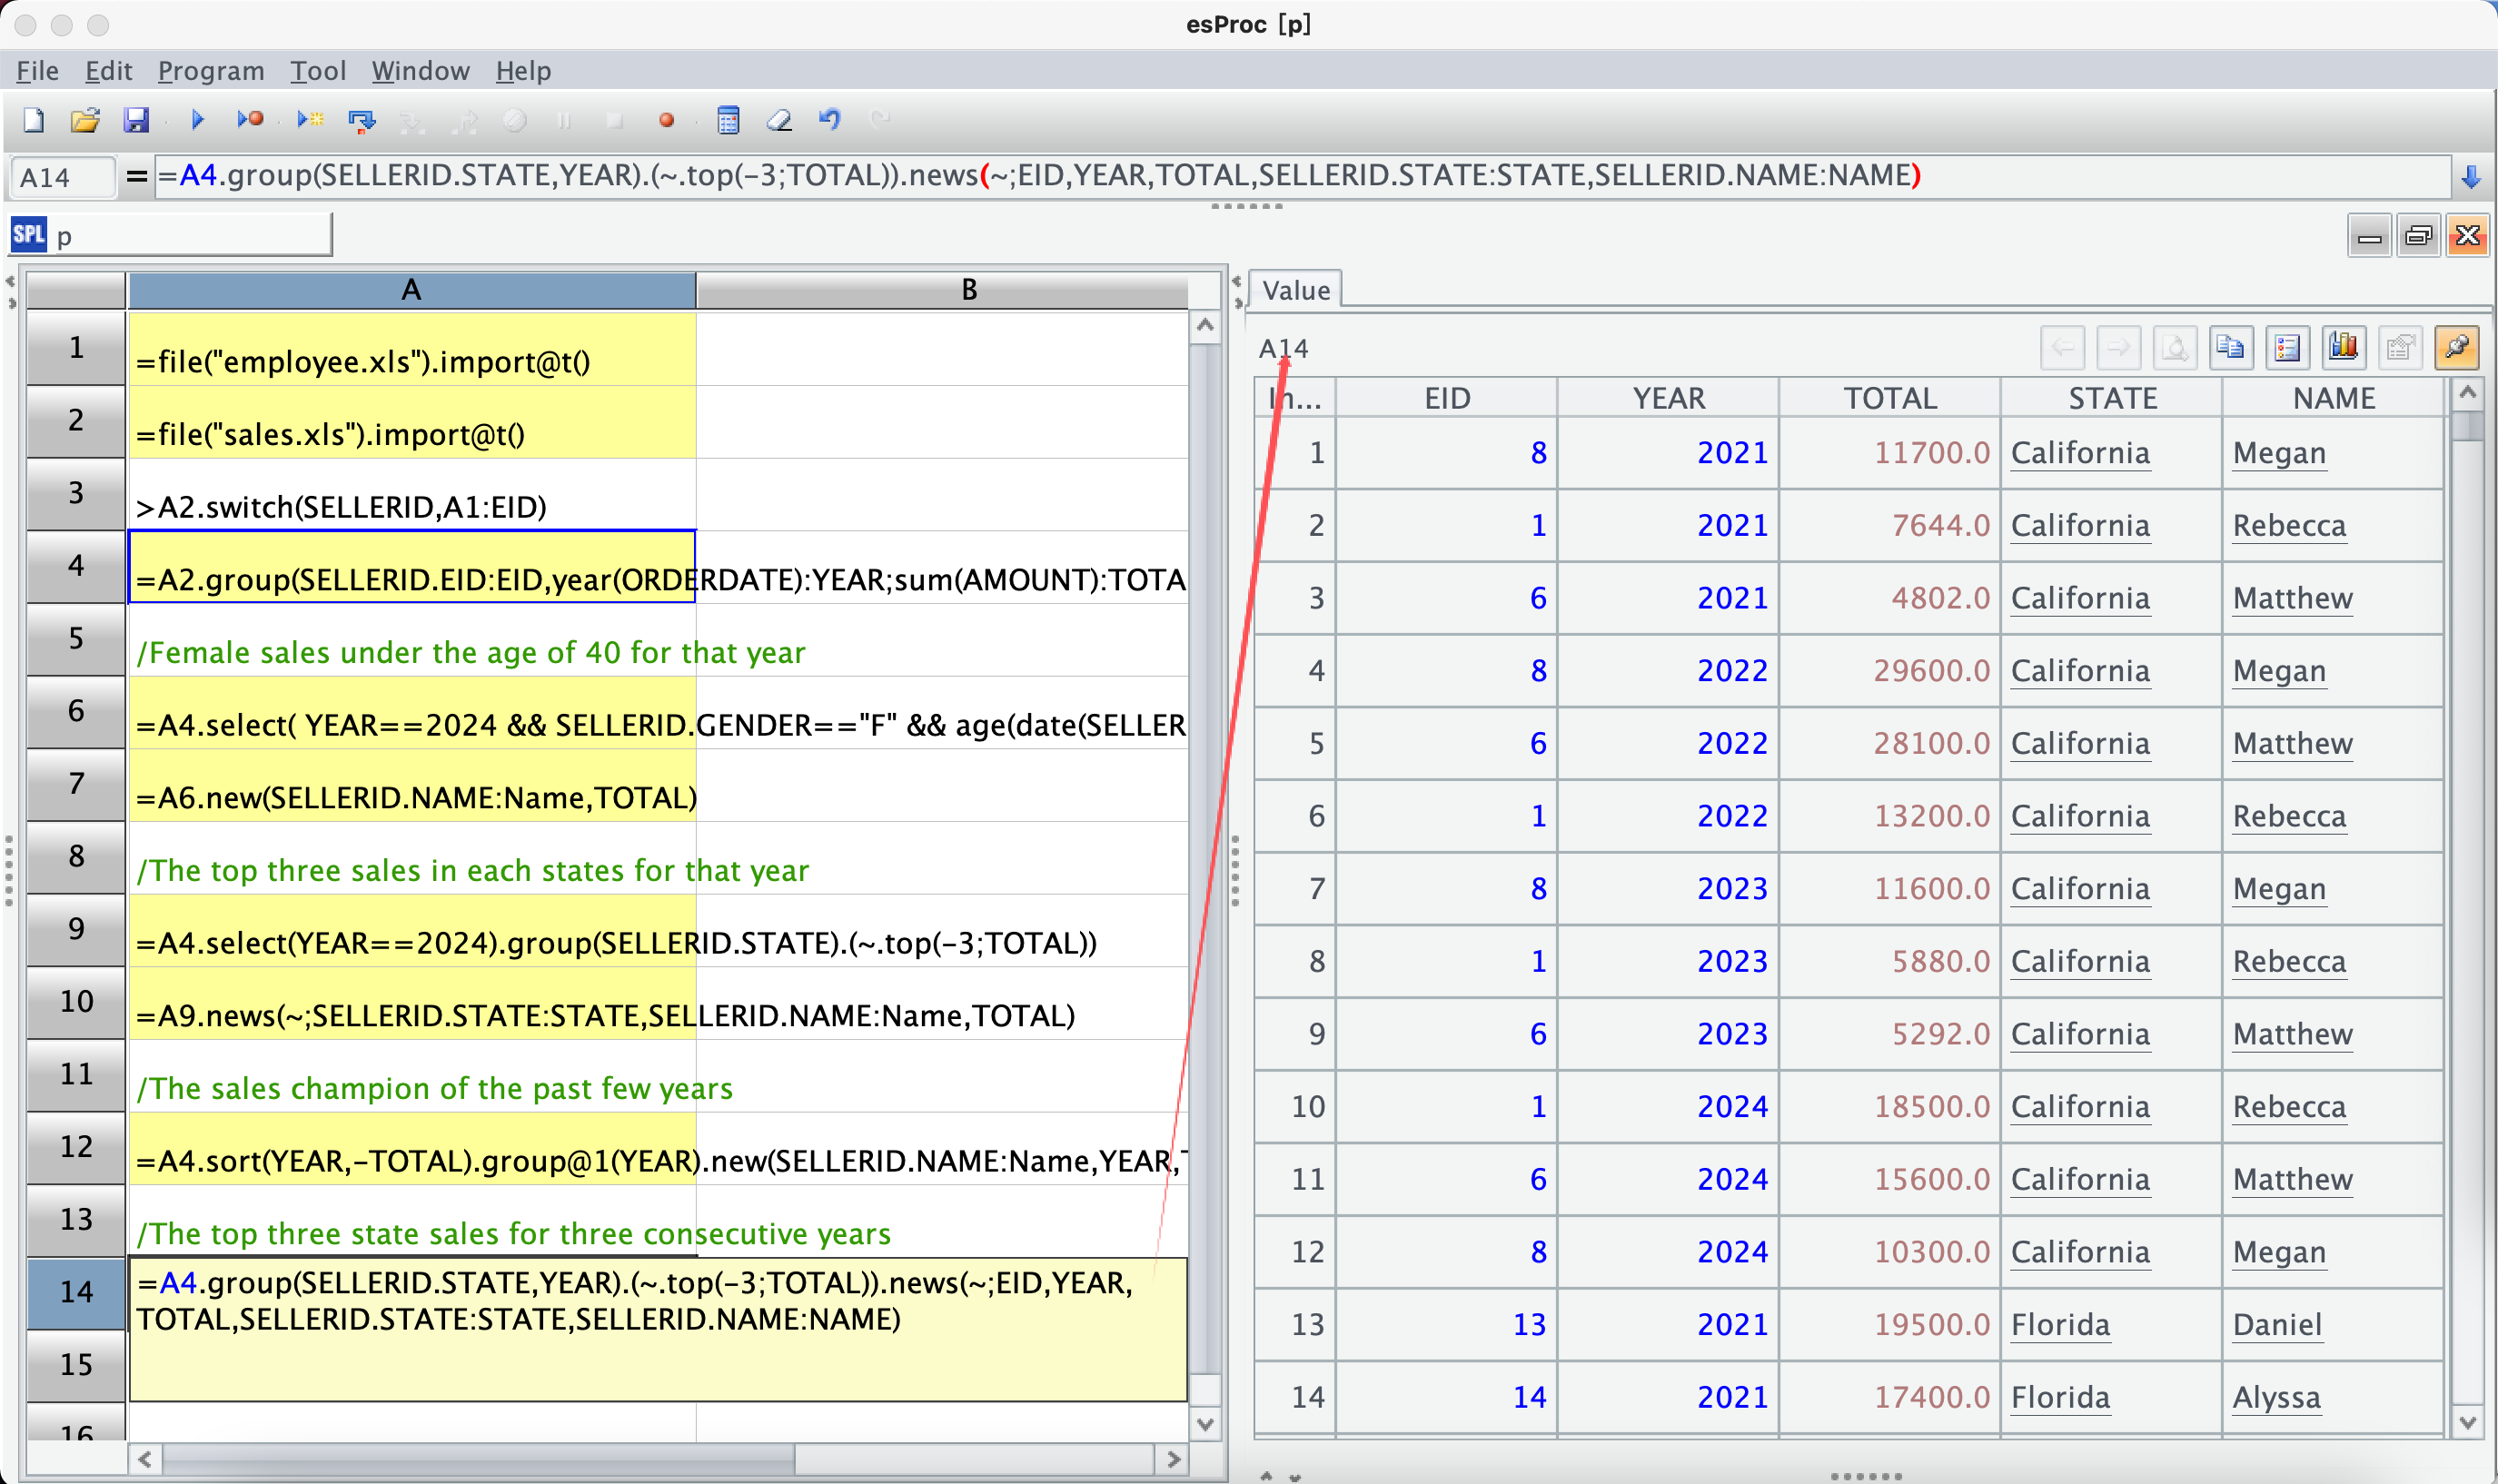
To find ’the top three salespeople in the state over three consecutive years,’ you first need to calculate the top three sales figures for each state over those years, and then check if the salespeople have been consistent year by year. In cell A14, group the data in A4 by the state and year of the employees, retaining only the top three records sorted by sales figures for each group. Then, use the new function to extract the corresponding field values from each record in the groups.
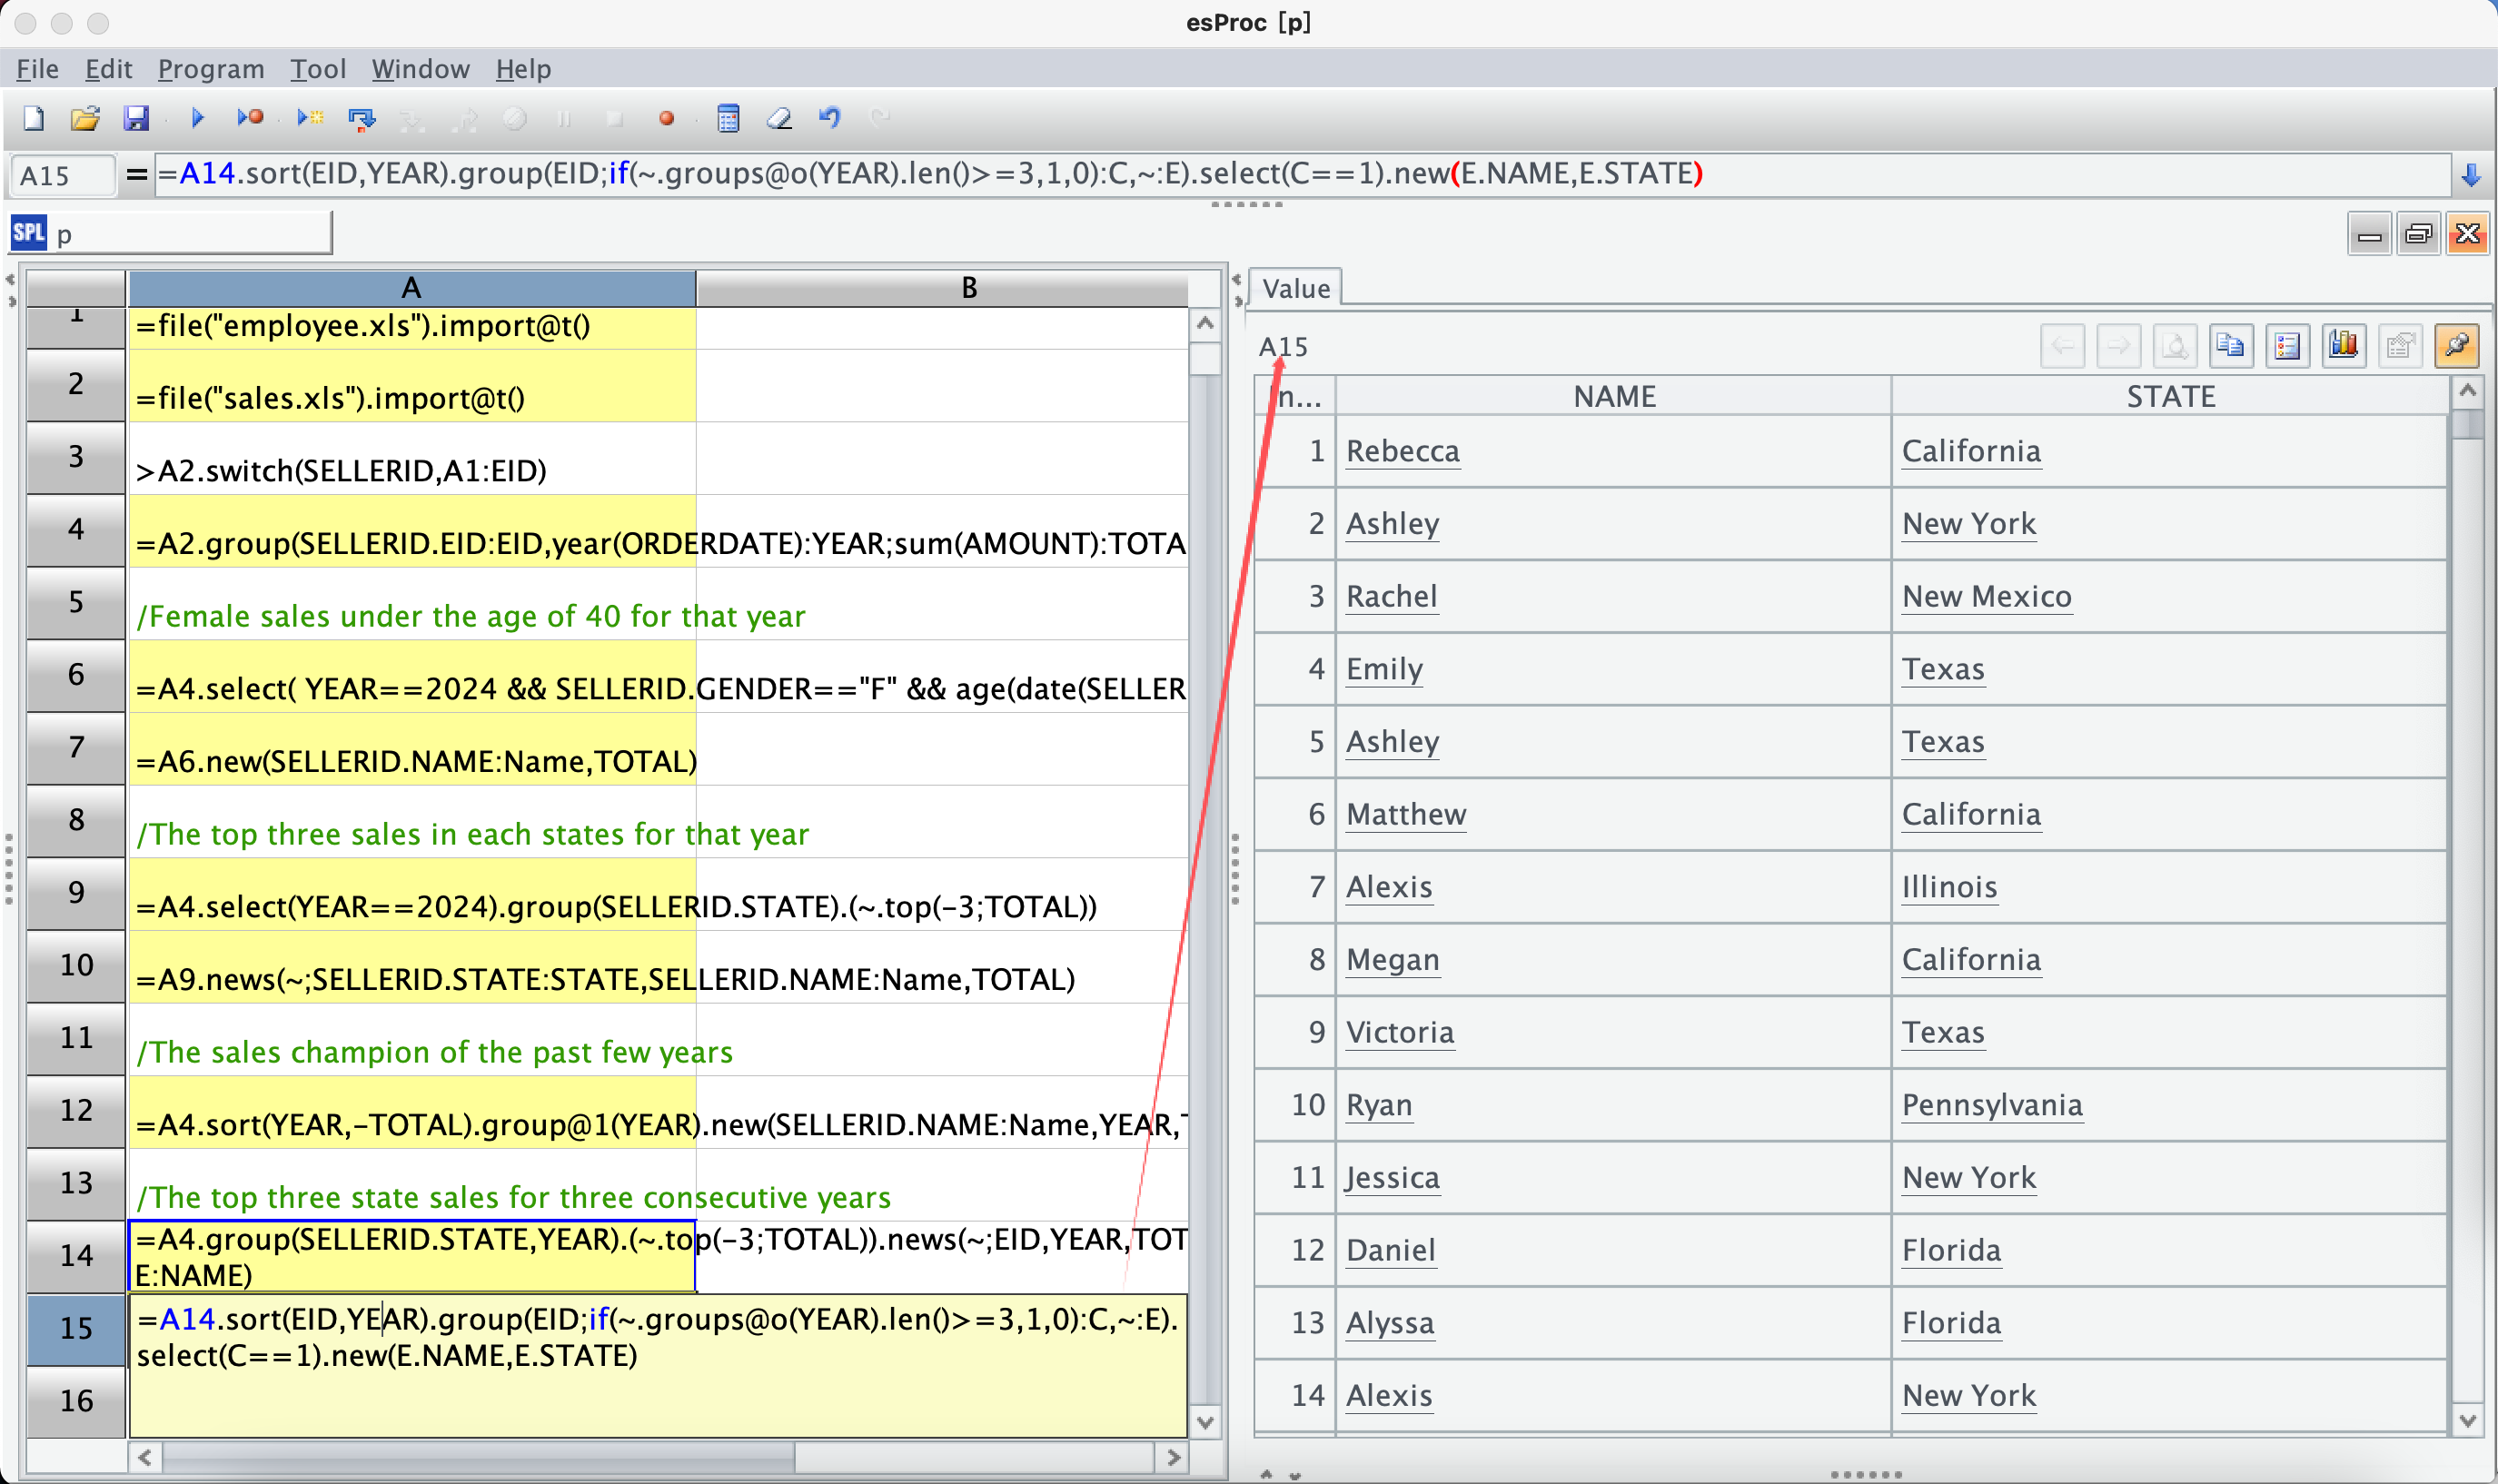
Next, to determine the continuity of the top three salespeople in each state, start in cell A15 by sorting the data by Employee ID and year. Then, group the data by Employee ID, followed by an expression to calculate continuity. If the years within the group are consecutive and greater than or equal to three, the result of this expression will be 1, indicating that the employee is consistently among the top three; otherwise, it will be 0. Finally, filter the results to extract the names and state names of those who have been the top three salespeople in the state for three consecutive years.
At this point, all calculation requirements have been met.
Summary and Extension
The data used in the calculations comes from the order table and the employee table, and in reality, the situation is much more complex. The order table may also link to customer tables, product tables, etc. During the data preparation phase, while some graphical user interface tools can be helpful, repeated operations are clearly less convenient than just a few lines of scripts.
During the data calculation phase, you can see how esProc allows for continuous multi-step calculations, making the process very convenient. Each line of code and the corresponding results are clear at a glance, and intermediate results can be reused repeatedly. Especially for the last problem, solving it with Excel formulas would be quite cumbersome, but using esProc for step-by-step solutions is easy to conceptualize and implement. There are many similar problems you can refer to the relevant use cases and books on the official website.

If you plan to program and automate your business calculations, esProc is an excellent choice. You’ll see the benefits for yourself!
SPL Official Website 👉 https://www.scudata.com
SPL Feedback and Help 👉 https://www.reddit.com/r/esProc_SPL
SPL Learning Material 👉 https://c.scudata.com
SPL Source Code and Package 👉 https://github.com/SPLWare/esProc
Discord 👉 https://discord.gg/cFTcUNs7
Youtube 👉 https://www.youtube.com/@esProc_SPL