Interactive Data Analysis from Excel to SPL: Consecutively Rising Stock Analysis
Here we are talking about analysis of consecutively rising stocks. To avoid ambiguity, we specify that the number of consecutively rising dates includes the initial date. For example, rising consecutively for 5 days means that a stock rises in a row in the 5 dates. Yet actually there are only 4 price increases that begin on the 2nd date.
Data structure and sample data:
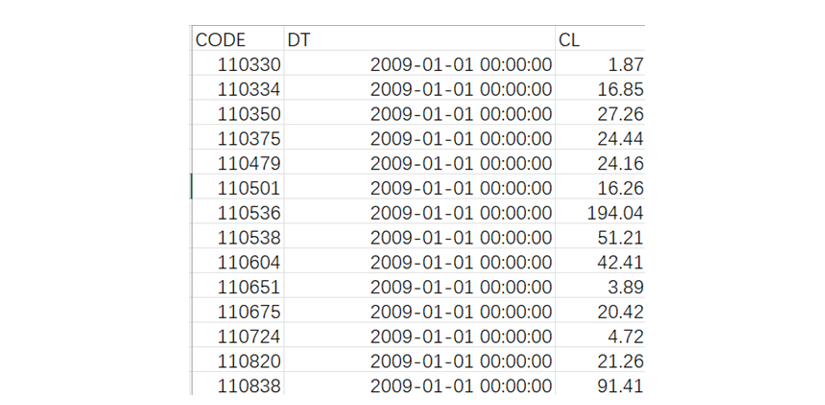
CODE is stock code, DT is transaction date, and CL is closing price.
1. Get a stock’s largest number of consecutively rising dates
Suppose the code of target stock is 100046, we handle the computing task respectively with Excel and with SPL.
Excel:
Use “Sort & Filter” to select records of the stock whose code is 100046 and sort them by date:
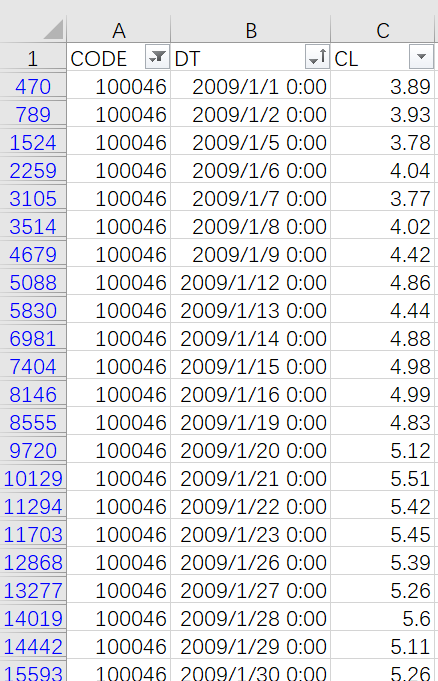
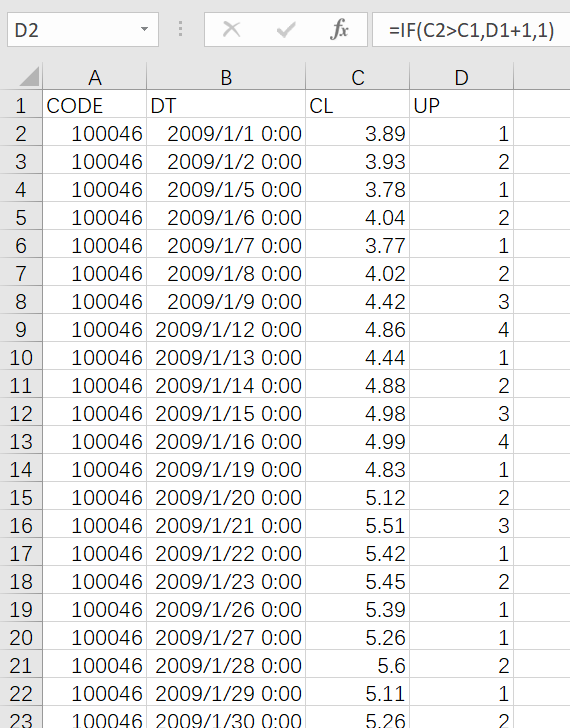
Copy the result records, and add column UP to record the count of consecutively rising dates.
Type in the following formula in D2:
=IF(C2>C1,D1+1,1)
Drag the formula to every other cells in the column and get the following table:
Find the largest UP column value:

SPL can handle the task using the same logic:
A |
B |
|
1 |
=T("StockRecords.xlsx") |
=0 |
2 |
=A1.select(CODE==100046).sort(DT) |
|
3 |
=A2.derive(B1=if(CL>CL[-1],B1+1,1):UP) |
|
4 |
=A3.max(UP) |
SPL is a programming language. Similar as Excel, it also writes formulas (code) in cells and can refer to values of cells.
A1 reads stock data from the Excel file.
SPL is highly interactive, allowing checking result of each step in real-time. Click A1 an A1’s data is displayed on the result viewing panel on the right:
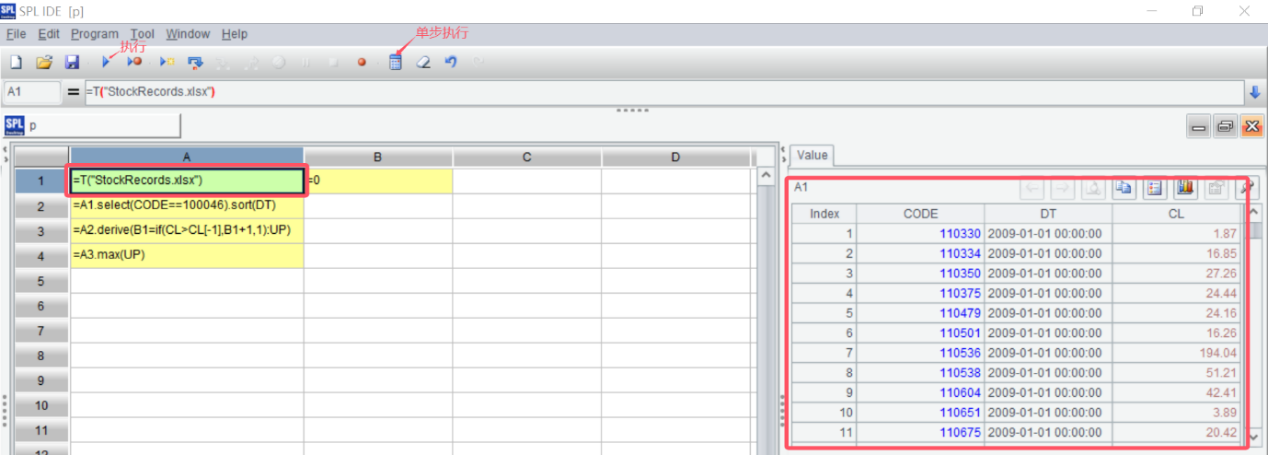
SPL can execute the whole code at a time, or execute code in each cell separately. Result of each executed cell can be viewed on the right of the panel.
A2 selects records of the stock whose code is 100046 and sorts them by date.
A3 adds column UP to record count of the consecutively rising dates. derive()add s a new column; CL[-1] is the closing price in the previous row.
A4 gets the largest UP value, which is the largest number of rising dates.
SPL writes simple formulas as Excel does. It can implement Excel’s problem-solving logics naturally in the same way. This is friendly to programmers who are accustomed to Excel. For them SPL is easy to learn.
The advantage of using a programming language is that its operation process can be recorded and reused for similar tasks. For this example, when data source is changed, SPL just needs to change the source file in A1. Excel, however, needs to perform the operation again on the new data.
Of course, another advantage of the programming language is that it has more powerful computing ability.
For this example, we can omit the step of generating the UP column and directly compute the largest value after we become familiar with the SPL programming:
A |
B |
|
1 |
=T("StockRecords.xlsx") |
=0 |
2 |
=A1.select(CODE==100046).sort(DT) |
|
3 |
=A2.max(B1=if(CL>CL[-1],B1+1,1)) |
In A3, A2.()is a loop function, which computes if() on each row of A2’s result set and returns the largest value.
SPL can also handle the task through grouping.
A |
|
1 |
=T("StockRecords.xlsx") |
2 |
=A1.select(CODE==100046).sort(DT) |
3 |
=A2.group@i(CL<=CL[-1]) |
4 |
=A3.max(~.len()) |
In A3, group@i()generates a new group whenever the result of expression CL<=CL[-1] in the parentheses is true, that is, stock price goes down. This way stock records with consecutively rising dates are put into the same group. As the following shows, records are divided into multiple groups. Double-click a group and its members are displayed.
For example, click the 3rd group and member records are displayed:

A4 computes the length of each group. The maximum length is the largest number of consecutively rising dates.
2. Find start date and end date of a stock’s longest consecutively rising interval
In Excel, we continue the operations based on those of the previous task. Select records whose UP values are 4 and get the ending date of the longest consecutively rising interval.
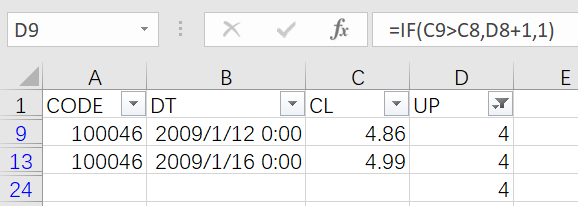
Then, in a similar way, write a formula in column E (as shown below) and get rows having value 4 to find the starting date of the longest consecutively rising interval.

Copy the starting dates and the ending dates to get the following result:

With cumbersome operations and formulas having circuitous logics, the Excel way of handling the task is inconvenient to use.
SPL uses the grouping method and produces simple logic, which puts consecutively rising records in the same group:
A |
|
1 |
=T("StockRecords.xlsx").select(CODE==100046).sort(DT) |
2 |
=A1.group@i(CL<CL[-1]).maxp@a(~.len()) |
3 |
=A2.new(~(1).DT:start,~.m(-1).DT:end) |
A2 changes max()for handling the previous task to maxp() to get records in all consecutively rising intervals.

A3 gets DT values of the first row and the second-to-last row, which are the corresponding starting date and ending date.
Excel can only return the largest value itself (such as 4 in this example) in the max-value-related computations. To get the other data in the row having the largest value, Excel needs to use the “Filter” functionality. The process is a bit cumbersome.
SPL offers much more aggregate operations, such as max()that gets the largest value, pmax() that gets position of the largest value and maxp() that gets the whole data row having the largest value. Each can be used to directly get the corresponding target data.
3. Find stocks whose largest count of consecutively rising dates is over 5
In Excel, sort records by CODE and DT and add UP column to store the count of consecutively rising dates.
Type in the following formula in D2:
=IF(AND(A2<>A1, C2>C1),D1+1,1)
Drag the formula to each of the other cells in UP column:
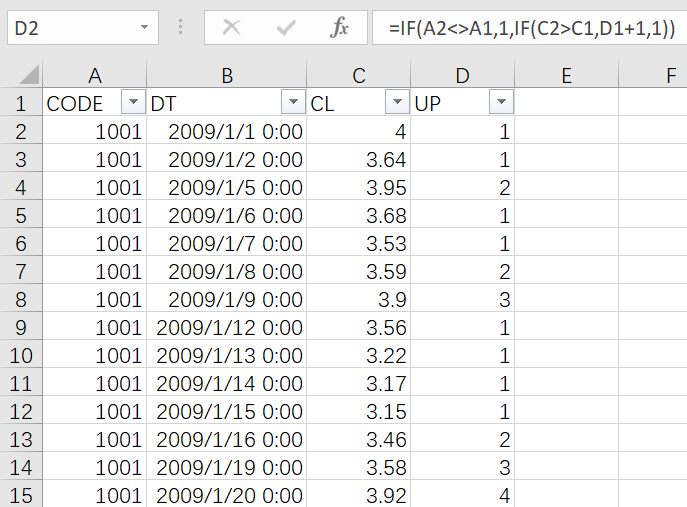
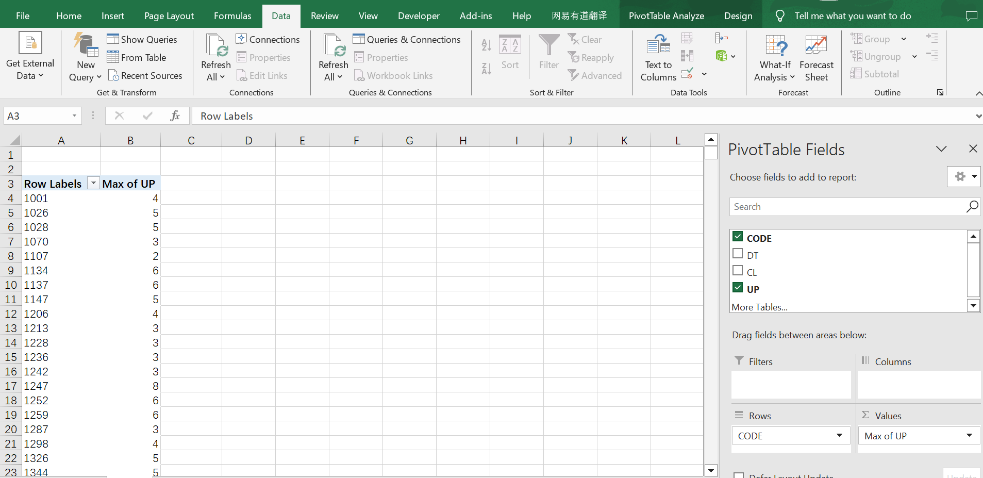
Then use PivotTable to group and summarize data to get the largest UP value for each stock.
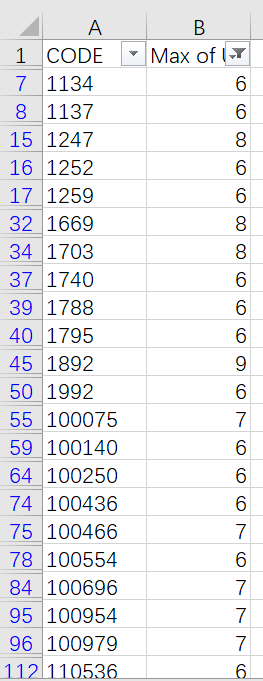
Copy the aggregate values to filter out stocks whose largest of UP value is over 5.
SPL can handle the task according to the same logic:
A |
B |
|
1 |
=T("StockRecords.xlsx").sort(CODE,DT) |
0 |
2 |
=A1.derive(B1=if(CODE==CODE[-1] && CL>CL[-1],B1+1,1):UP) |
|
3 |
=A2.groups(CODE;max(UP):max_up) |
|
4 |
=A3.select(max_up>5) |
A1: SPL reads data and sort them by CODE and DT.
A2: Add a helper column UP to record the count of consecutively rising dates. SPL’s if() function can perform the multi-condition judges without the need of nested queries.
A3: Perform grouping and summarization to find the largest UP value for each stock. groups() is a grouping & aggregation function.
A4: Select stocks that consecutively rise for over 5 dates.
The syntax of SPL functions is intuitive. It is easy for one who can use Excel to understand the SPL code.
A programming language records each operation step. In another similar scenario or in a scenario where only the data source is changed, the code can be reused without being rewritten. Excel cannot record the operation steps it has performed. The next time when a same task appears, it needs to perform the same operations. Moreover, the Excel operations generate intermediate data. As time passes, data becomes messy.
The task can be handled only through grouping without aggregation. The UP column is not needed.
A |
|
1 |
=T("StockRecords.xlsx").sort(DT) |
2 |
=A1.group(CODE;~.group@i(CL<=CL[-1]).max(~.len()):max_increase_days) |
3 |
=A2.select(max_increase_days>5) |
A2: Group stock records by CODE and then records of each group to put those with consecutively rising prices in the same group, and compute the largest count of consecutively rising dates. ~ represents the current member during the loop. Here it is the currently looped group of stock records.
Excel only has the categorizing & summary function. This makes it inconvenient to handle computations that based on the categorized (grouped) subsets. The next task is an example.
Besides the grouping & aggregation function groups(), SPL also offers group() function to only categorize (group) data without aggregation. The group() function can retain the grouped subset for later computations.
4. Find all intervals when the largest count of consecutively rising dates is over 5
Excel grouping operation forces aggregation and cannot retain the grouped subsets. It is inconvenient to handle this task with Excel.
It first filters out records of stocks that rise consecutively for over 5 dates to get the ending dates of the consecutively rising intervals, and then search for and get their starting dates. Then find the corresponding stock prices by CODE and DT. The Excel operations are too cumbersome, and we just skip it here.
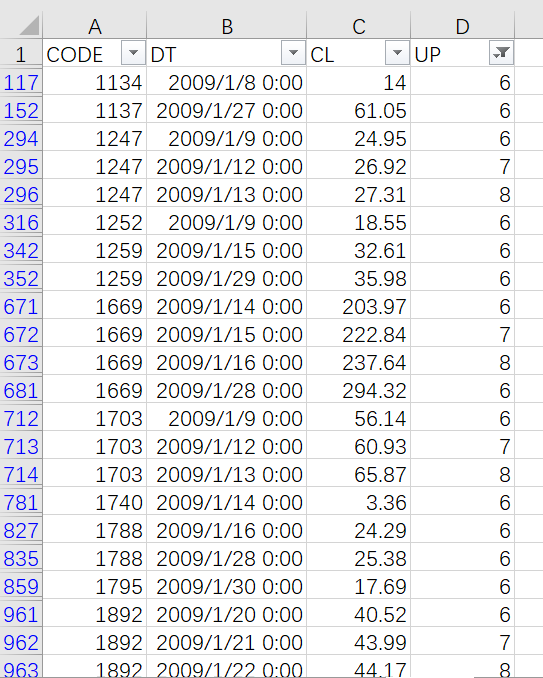
SPL can retain the grouped subsets. It is easy for it to deal with the task:
A |
|
1 |
=T("StockRecords.xlsx").sort(CODE,DT) |
2 |
=A1.group@i(CODE!=CODE[-1] || CL<=CL[-1]) |
3 |
=A2.select(~.len()>5).conj() |
A2’s grouping condition indicates that a new group will be created whenever the stock code changes or stock price does not rise. Similar to CL[-1], CODE[-1] represents the stock code of the previous record. As the stock records are all ordered by CODE, different stocks won’t be put into the same group.
A2 only groups records without performing any aggregation, and thus retains grouped subsets:

A3 selects groups that have more than 5 members and concatenates these grouped sets to get the final result.
SPL Official Website 👉 https://www.scudata.com
SPL Feedback and Help 👉 https://www.reddit.com/r/esProcSPL
SPL Learning Material 👉 https://c.scudata.com
SPL Source Code and Package 👉 https://github.com/SPLWare/esProc
Discord 👉 https://discord.gg/2bkGwqTj
Youtube 👉 https://www.youtube.com/@esProc_SPL


