Data Analysis Programming from SQL to SPL: Medical Visit Records Analysis
Data structure
Medical visit records table (Appointments):
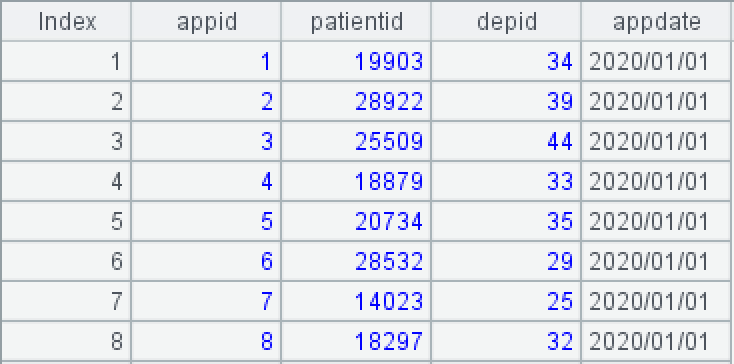
appid is the medical visit ID, patientid is the patient ID, depid is the department ID, and appdate is the medical visit date.
1. Query for the times when the number of visits reached a multiple of 50,000 in 2020 and 2021, respectively
The expected target results are shown in the figure below:

SQL statement:
with t1 as (
    select appid,patientid,depid,appdate,
	 row_number() over(partition by year(appdate) order by appdate) rn
    from appointments
    where appdate between '2020-01-01' and '2021-12-31'
),
t2 as (
    select rn appnum,
	  max(if(year(appdate)=2020,appdate,null)) `2020`,
	  max(if(year(appdate)=2021,appdate,null)) `2021`
    from t1
    where rn%50000=0
    group by rn
)
select * from t2;
While the window function is used, the SQL statement still needs to nest multiple layers of code, which is a bit cumbersome. This is mainly because SQL’s result sets are unordered, requiring the addition of implicit markers to implement ordered operations.
This problem is actually very simple: group the Appointments by year, select all records within each group where the count is an integer multiple of 50,000, and then construct the required target structure.
In SPL, all sets are ordered, allowing direct access to member records by their index, which greatly simplifies the implementation of ordered operations. SPL script:
A |
|
1 |
=T("appointments.txt").select([2020,2021].contain(year(appdate))) |
2 |
=A1.sort(appdate).group@o(year(appdate)).(~.select(#%50000==0)) |
3 |
=A2.max(~.len()).new(#*50000:appnum,A2(1).m(#).appdate:'2020', A2(2).m(#).appdate:'2021') |
A1: Read the Appointments and select the records of 2020 and 2021.
SPL IDE is highly interactive, allowing for intuitively viewing the results of each step in the right-hand value panel after execution.

A2: Sort by visit date, group by year, and take each group’s records whose index is divisible by 50,000.
The @o option of the group function is used here to perform ordered grouping. Create a new group when the visit date’s year changes:

Clicking A2, you can see that the records are divided into two groups by year, with each group containing all records from the same year.


A3: Add records according to the length of the longest group to generate the desired target structure.

2. Query for the times when the number of patients reached a multiple of 5,000 in 2020 and 2021, respectively
If a patient has multiple visit records in a year, only the first visit record in that year is counted. The expected target results are shown as below:

SQL statement:
with t1 as (
    select appid,patientid,depid,appdate,
        row_number() over(partition by year(appdate),
        patientid order by appdate) rn
    from appointments
    where appdate between '2020-01-01' and '2021-12-31'
),
t2 as (
    select *
    from t1
    where rn=1
),
t3 as (
    select *,
        row_number() over(partition by year(appdate) order by appdate) rn2
    from t2
),
t4 as (
    select rn2 patnum,
        max(if(year(appdate)=2020,appdate,null)) `2020`,
        max(if(year(appdate)=2021,appdate,null)) `2021`
    from t3
    where rn2%5000=0
    group by rn2
)
select * from t4;
Despite the addition of just one step, which is to select the patient’s first visit record, the complexity of the SQL statement increases significantly.
For SPL, you can still follow the natural logic, and you just need to select the patient’s first visit record based on problem 1:
A |
|
1 |
=T("appointments.txt").select([2020,2021].contain(year(appdate))) |
2 |
=A1.sort(appdate).group@o(year(appdate)) |
3 |
=A2.(~.group@u1(patientid).select(#%5000==0).new(#*5000:patnum,year(appdate):year,appdate)).conj() |
4 |
=A3.pivot(patnum;year,appdate) |
A3: Take each patient’s first visit record of each year, and then take the records whose position index is divisible by 5,000. The @1 option of the group function takes only the first record of each group when grouping, and @u option keeps the original order during grouping.
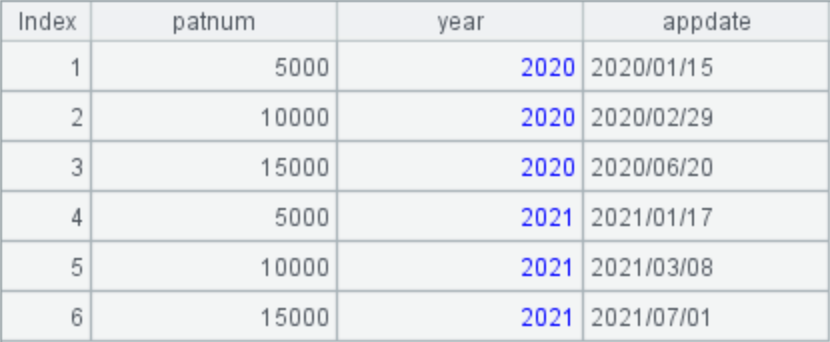
A4: Pivot the years onto columns:

This SPL script is not much more complex than the one in Problem 1. SPL supports step-by-step computation; you only need to add one step to select the patient’s first visit record.
3. Count the number of patients with more than 8 follow-up visits each year
The calculation rules for follow-up visits in the same department are: ignore revisits occurring less than 12 days after the previous visit; only revisits occurring between 12 to 18 days are considered follow-up visits.
Since SQL cannot effectively describe ordered loop calculations after grouping, the SQL solution will not be provided here.
The SPL solution to this problem is still not complex. Simply follow the natural logic: group visit records by year, department and patient ID. Then, loop through each group to calculate the number of follow-up visits. Finally, select all patients with more than 8 follow-up visits.
A |
|
1 |
=T("appointments.txt").sort(appdate) |
2 |
=A1.group(year(appdate):year,depid,patientid;~.sum(if(#==1 || appdate-a>18:(a=appdate,0),appdate-a<12:0;(a=appdate,1))):num) |
3 |
=A2.select(num>8) |
4 |
=A3.groups(year;icount(patientid):count) |
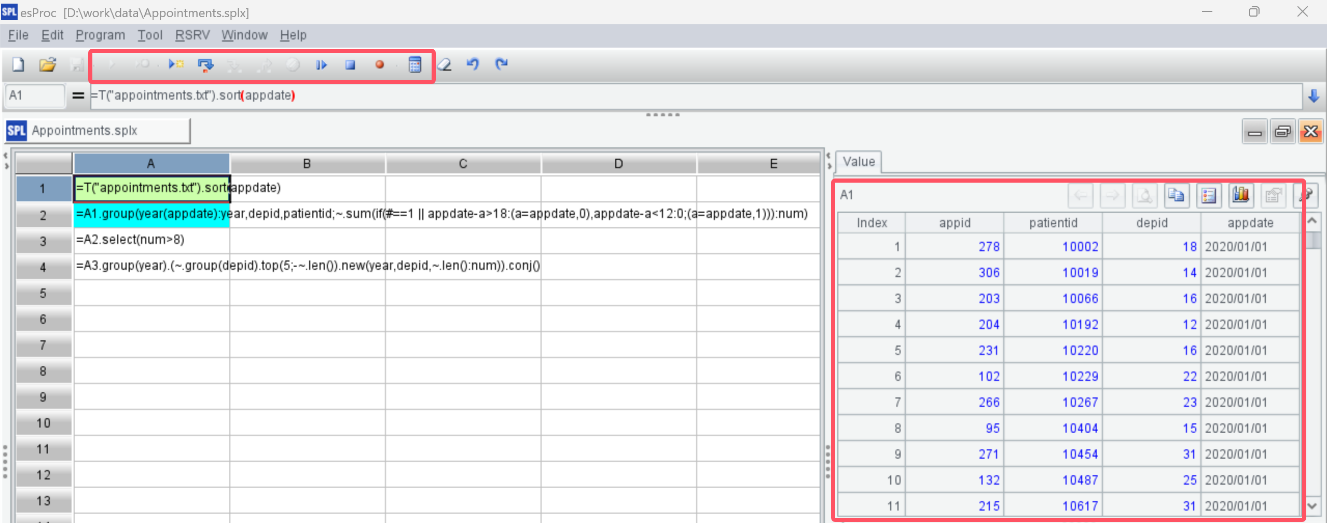
A2: Calculate the number of follow-up visits for each patient in each department each year. Utilize the group function to group by year, department, and patient. The members of each group are all the visit records of a patient in a specific year and department. Then, calculate the number of follow-up visits for each group. Here, the if function is used for multiple condition checks: if it’s the first visit or the visit date is more than 18 days after the previous visit, set the variable a to the current visit date and add 0 to the follow-up count; if the visit date is less than 12 days after the previous one, the follow-up count is 0; if neither of these conditions is met, it’s a follow-up visit record. Set a to the current visit date, and add 1 to the follow-up count.
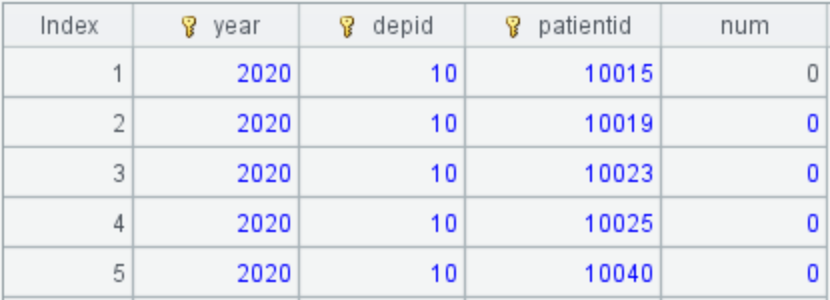
A4: Count the number of patients who exceed 8 follow-up visits each year:

This SPL script is not significantly more complex compared to the previous two. This is primarily attributed to the fact that SPL supports independent group calculations and keeps grouped subsets after grouping, which allows for continued complex calculations on these subsets, rather than being restricted to common aggregate calculations in SQL like SUM and COUNT.
4. Find the top 5 departments ranked by the number of patients with more than 8 follow-up visits each year
Compared to the previous problem, this problem, after calculating patients with more than 8 follow-up visits, needs to calculate the number of follow-up patients by department and then take the top 5 departments. When solving this problem with SPL, you can directly copy the A1:A3 section from the previous script, and then group by year to select the top 5 departments with the highest number of follow-up visits.
A |
|
1 |
=T("appointments.txt").sort(appdate) |
2 |
=A1.group(year(appdate):year,depid,patientid;~.sum(if(#==1 || appdate-a>18:(a=appdate,0),appdate-a<12:0;(a=appdate,1))):num) |
3 |
=A2.select(num>8) |
4 |
=A3.group(year).(~.group(depid).top(5;-~.len()).new(year,depid,~.len():num)).conj() |
A4: Calculate the top 5 departments ranked by the number of patients with more than 8 follow-up visits each year. Group the follow-up records selected in A3 by year. Then, group each year’s records by department and select the top 5 departments ranked by the number of follow-up visits. Finally, construct the target dataset.
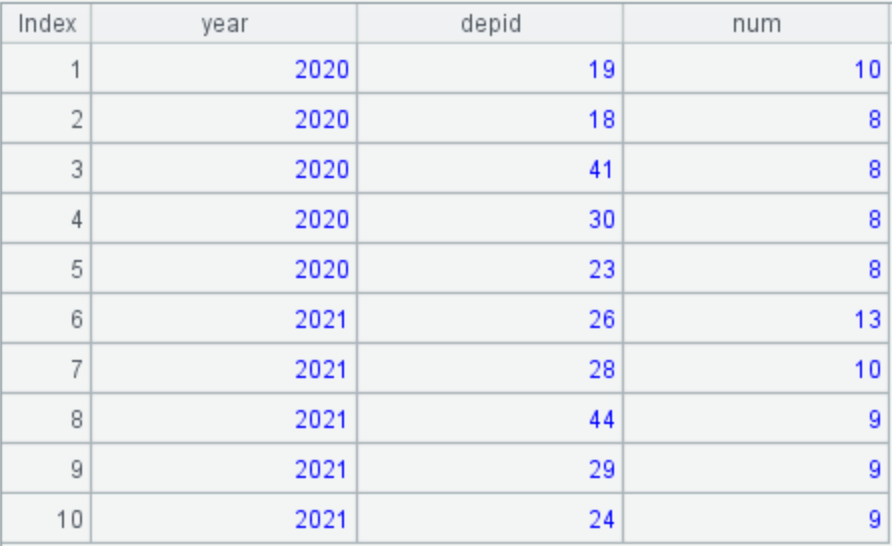
As seen through these increasingly complex examples, when employing SPL to solve relatively complex problems, you can simplify the problem by dividing it into smaller, easier-to-solve sub-problems. In addition, The SPL IDE supports step-by-step debugging, so you don’t have to write the whole script at once; instead, you can debug and modify as you go, completing it gradually.
Data file attachment:
SPL Official Website 👉 https://www.scudata.com
SPL Feedback and Help 👉 https://www.reddit.com/r/esProcSPL
SPL Learning Material 👉 https://c.scudata.com
SPL Source Code and Package 👉 https://github.com/SPLWare/esProc
Discord 👉 https://discord.gg/2bkGwqTj
Youtube 👉 https://www.youtube.com/@esProc_SPL


Chinese version