Excel’s Advantages and Disadvantages in Data Analysis
In daily work, when it comes to data calculation and analysis, Excel is definitely the most frequently used tool. However, many people are also confused by some issues of Excel, such as the difficulty of in-depth learning of Excel, the challenges of tackling complex problems, the repetitiveness of solving the same problems, and the inability to handle big data. In this article, we will discuss Excel’s advantages and disadvantages in data analysis, and how to overcome such issues.
Let’s first look at the advantages of Excel.
1. Simple, easy to learn and get started
Firstly, Excel offers many function menus, allowing users to perform numerous tasks just by clicking the mouse. Its simplicity enables almost anyone to use it for basic data processing and analysis. For example, to sort math scores by class from highest to lowest, you can achieve this by directly clicking the corresponding menu function.

Secondly, Excel formulas are very intuitive to write, enabling you to directly reference cell contents for computation. For example, to calculate each student’s total score, you can directly add the corresponding cells in column F. This aligns with our way of thinking when solving arithmetic problems, making it very easy to get started.

2. High interactivity, allowing for obtaining calculation results in real time
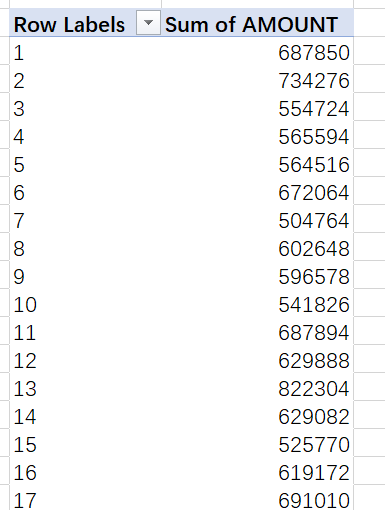
The extensive application of Excel can be attributed not only to its low use threshold but also to its highly interactive capabilities. In Excel, the results of each calculation step can be obtained directly. For example, there is an order data table, we want to calculate each salesperson’s total sales by SELLERID:
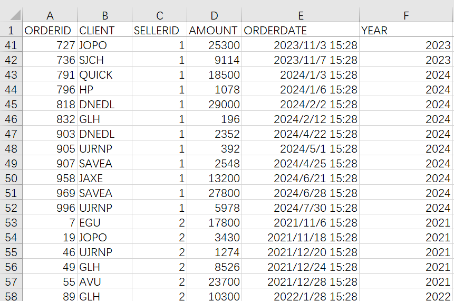
After manipulating with the PivotTable, you can directly see the grouped and summarized results, achieving a “what you see is what you get” effect. This is very important for data analysts, as in many tasks, they need to decide what to calculate next based on the results of the previous step.
It is precisely these two major advantages that have made Excel the most widely used tool. But with the explosive growth of data and increasingly complex business requirements, the disadvantages of Excel have gradually become clear.
1. Difficult to reproduce the analysis process
First, data analysis cannot be performed in a single step but often requires multiple steps of continuous computation. Although many operations in Excel are performed via mouse clicks, which provides a good user experience, it cannot record the analysis process. When facing new data, repetitive work is required.
Let’s take a simple example, there are two data tables.
The order data table records sales order information for the past few years.

The employee information table records basic information of all employees.

Now we want to find female salespeople under 40 years old and calculate their average annual sales.
This problem isn’t difficult, and we can probably solve it through the following steps:
(1) Employ the YEAR() function to extract the year information from the order data.
(2) Use the PivotTable to summarize each salesperson’s annual sales.
(3) Adjust the format of the pivot table to a style that facilitates next calculation, which requires approximately 3 to 4 mouse operations.
(4) Copy the pivot table data.
(5) Use the VLOOKUP function to associate the two tables.
(6) Filter the associated table to select the annual sales data of female salespeople under 40 years old.
(7) Copy the filtered data.
(8) Calculate the average.
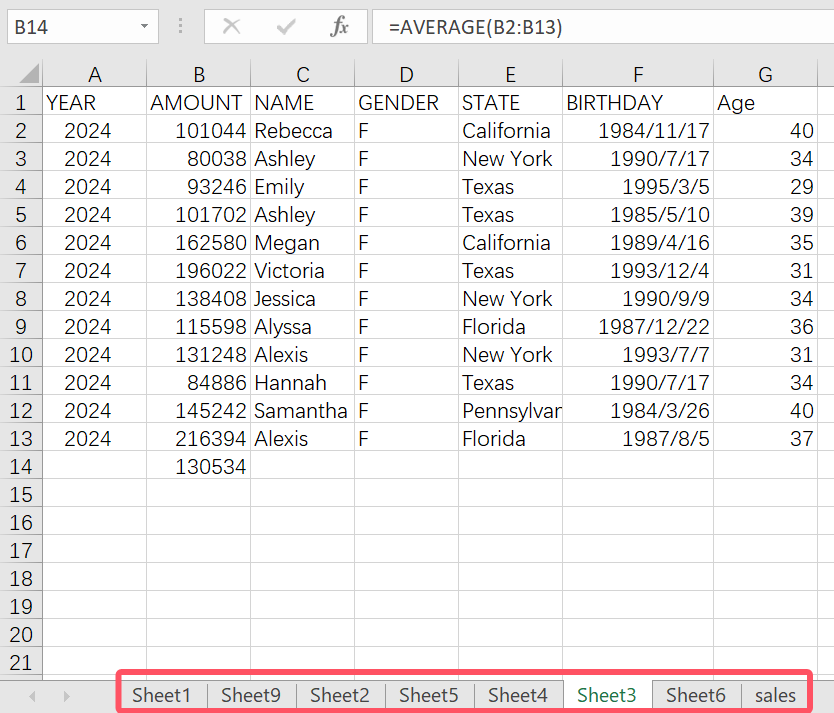
When using Excel, although the user experience is good and calculation results are displayed in real time, the operation process cannot be recorded. Each step is isolated, and intermediate data is generated. For example, when the steps for this problem are done, several sheets (as shown below) will be generated in Excel, which can easily lead to confusion. If a condition or step needs to be modified, you have to check them one by one. When the source data is changed, it is difficult to reproduce the operation process, and you have to re-do the entire process, which is time-consuming and laborious.
In data analysis projects, the problems we encounter are often much more complex than this one. For complex projects, even experienced Excel users are hesitant to reproduce the process, and it’s even harder to ensure consistent requirements and accurate results every time. Not to mention updating data monthly or even weekly, you wouldn’t be able to finish it even with overtime.
2. Cumbersome to solve complex problems
Excel is, after all, a spreadsheet software, and many of its functionalities are designed to produce a highly visual table. Therefore, its calculation capabilities are limited. When facing slightly more complex problems, the implementation difficulty increases, or the operation steps become very cumbersome. For example, in the previous example of associating two tables, Excel lacks a dedicated association function, so VLOOKUP is generally used. VLOOKUP is essentially a lookup function that can only return values of a single column at a time. To return values of multiple columns, the formula needs to be written multiple times. If you want to return values based on the column name, you need to use VLOOKUP in conjunction with a position lookup function, which significantly increases the difficulty of writing formula. If association is based on multiple conditions (e.g., based on name and region), VLOOKUP cannot be used directly and alternative methods must be explored. A slight alteration in the requirements necessitates a change in method. The underlying reason is the limited calculation capabilities of Excel’s functions. Excel seems like it can do everything, but it actually doesn’t do anything well, and many problems require workarounds. It becomes even more difficult to handle complex business problems such as finding a list of personnel who have been in the top 3 in provincial sales for 3 consecutive years, calculating the number of users active for three consecutive days within each 7-day period, and calculating the next-day retention rate of new users each day.
3. Frustrated when facing big data
Excel only supports data up to 1 million rows.
When the data volume exceeds 100,000 rows, Excel calculations become very slow, and may even crash.
With the growing demand for data analysis, more and more people are resorting to programming languages for assistance. Indeed, programming languages can very effectively solve Excel’s shortcomings. They can record the whole analysis process, enabling automated workflows and avoiding repetitive work. They also offer more powerful computing capabilities, making them capable of addressing complex problems and handling big data calculations. But unfortunately, while addressing Excel’s shortcomings, most programming languages lose Excel’s two major advantages: easy to get started and high interactivity.
The habits and thought processes of programming language users differ significantly from those of Excel users. This makes programming a high entry barrier for ordinary users. While numerous individuals want to self-learn programming, the success rate is estimated to be less than 10%. Moreover, programming languages are not invented for data analysis and calculations, and thus they lack interactivity. Interactivity is a crucial requirement for data analysis. Data analysts need to know the results of each step to decide how to calculate the next step.
So, is there a programming language that can address Excel’s shortcomings while retaining its advantages?
Yes, SPL.
SPL is a programming language specifically invented for structured data calculations. It has all the calculation advantages of a programming language, and it’s even stronger. Moreover, it also has good interactivity, making it very suitable for data analysis.
1. High interactivity, particularly user-friendly for Excel users
SPL also operates in cells, making it look very similar to Excel.

Like Excel, SPL can also reference cell contents to write formula code. For example, the code of A2 and A3 are easily understandable without additional explanation. The difference is that the results of Excel are displayed in the cell where the formula is entered, while the results of SPL are displayed on the right side of the interface and clicking on a cell will show the result for that cell. The advantage of such display method is that it allows you to record the computation process while maintaining high interactivity, and analysts can write and observe simultaneously, making it exceptionally user-friendly.
SPL, as a programming language, has richer cell values than Excel. In addition to single values, SPL’s cell value can also be a set of values like [3,5,7,8], or a table like the previous example of the class grade sheet. As shown in the figure below, the result of A1 is a table, called table sequence in SPL. The code in A1 means to read the data into SPL.
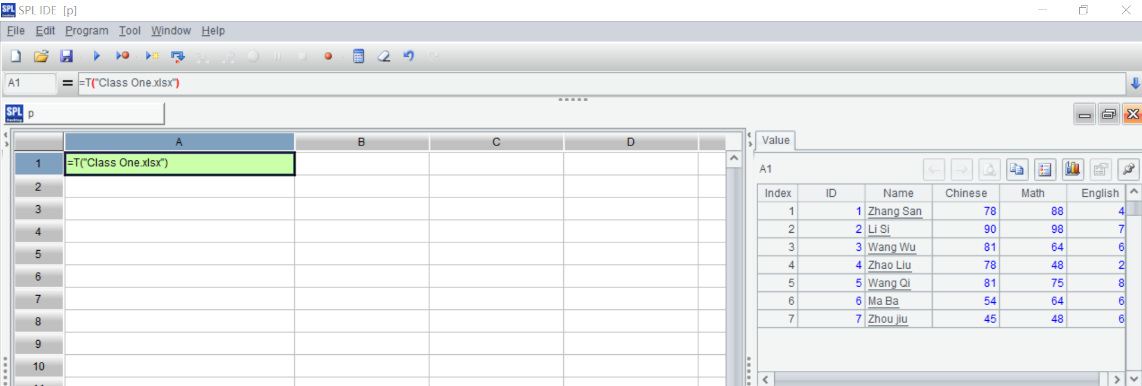
Next, sort by math score in descending order and calculate the total score. In SPL, it’s written like this:

The syntax is simple and intuitive, easy to understand at a glance. You can view the calculation results in real time on the right, and errors can be corrected immediately.
In terms of user experience, SPL greatly respects the established habits of Excel users, thereby lowering the programming threshold for ordinary users.
2. Enabling the recording of the analysis process and allowing its reproduction at any time
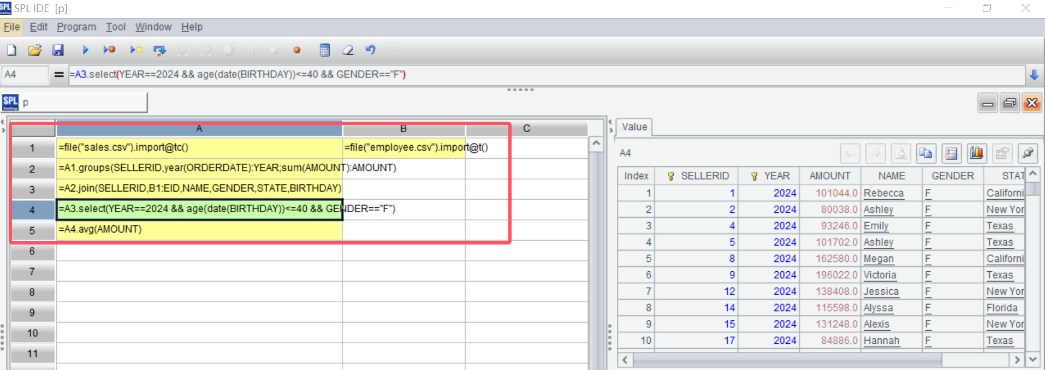
For the example of find female salespeople under 40 years old and calculate their average annual sales, it requires multiple steps in Excel, which is a confusing process that is difficult to reproduce.
As a programming language, SPL can record the operation process. When data is changed, you just need to replace the data source without repetitive work. When conditions change, it’s also very easy to modify.
3. Easy handling of complex problems
The biggest advantage of programming languages is their powerful computing capabilities. SPL is no exception. Many complex or cumbersome Excel problems are easily addressed in SPL. For example, the code for the association of two tables using VLOOKUP in the sales example mentioned earlier is:
=VLOOKUP($A2,employee.xlsx!$A$1:$I$501,MATCH(D$1,employee.xlsx!$A$1:$I$1,0))
The code needs to use two functions, and it also needs to consider whether to use an absolute reference for the row or column in the parameters. The logic is complex, and it’s prone to errors.
SPL has dedicated association function, allowing you to directly use column names. For example, to associate B1’s fields like NAME and GENDER onto A2 based on ID, the code is:
=A2.join(SELLERID,B1:EID,NAME,GENDER,STATE,BIRTHDAY)
SPL provides rich calculation functions, making it easy to solve various complex business problems. For more solutions to Excel puzzles, visit SPL Desktop Analysis on our official website where various resources are available and convenient to search, so we will not give other examples here.
4. Smooth big data processing
Excel will become very slow when dealing with data volume exceeding 100,000 rows. SPL doesn’t have this problem; it can handle data with 100,000 or even a million rows very smoothly. In addition, SPL provides simple cursor operations, allowing you to read data in a streaming fashion, so any data volume can be handled.
SPL Official Website 👉 https://www.scudata.com
SPL Feedback and Help 👉 https://www.reddit.com/r/esProcSPL
SPL Learning Material 👉 https://c.scudata.com
SPL Source Code and Package 👉 https://github.com/SPLWare/esProc
Discord 👉 https://discord.gg/2bkGwqTj
Youtube 👉 https://www.youtube.com/@esProc_SPL


