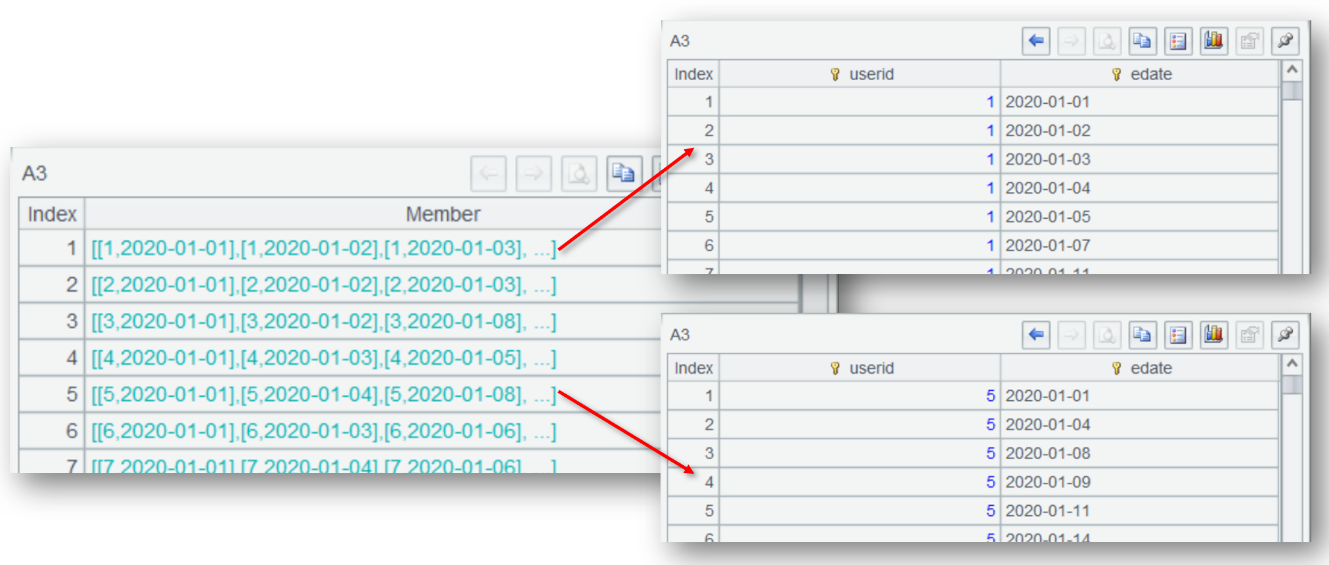
Using SQL for data analysis seems to be a false proposition
Using SQL for data anlysis is actually quite basic
SQL is widely used for data analysis and often considered a default skill of data analysts. Indeed, being able to write SQL in a database environment is very convenient; it might seem as if you can solve any query by just writing a single SQL statement. For example, when you want to find sales grouped by user, the SQL code written out is as simple as English:
SELECT area, SUM(amount)
FROM sales
WHERE amount > 1000
GROUP BY area
However, data analysis tasks are not always that simple. For example, to calculate the next-day retention rate of new users, the SQL code will generally be:
with t1 as (
    select userid, date(etime) edate from actions group by userid,date(etime)),
t2 as (
    select userid, edate, row_number() over(partition by userid order by edate) rn
    from t1
),
firstday as (
    select userid, min(edate) frst from t2 group by userid),
retention as (
    select fd.userid, frst, t.edate nxt
    from firstday fd left join t2 t
    on fd.userid=t.userid and date_add(fd.frst, interval 1 day)=t.edate
    group by fd.userid, frst, nxt
)
select frst edate, count(nxt)/count(frst) rate
from retention
group by edate
order by edate;
Due to the unordered nature of SQL sets, you have to manually create sequence numbers to mark ordered events in order to identify new users. Moreover, because SQL cannot retain the grouped member sets, calculating user retention requires nesting subqueries and repeatedly associating, which greatly increases the difficulty of understanding and coding. Even professional DBAs find such SQL code painful; it’s likely that very few data analysts can actually write such complex code, and as a result many will just have to “sigh at the need”.
Even if you can barely manage to accomplish this task, there’s an even tougher one: calculate on a daily basis the number of users who have been continuously active for 3 or more days within the past 7-day period.
This is a real requirement, which is so difficult that it is almost impossible to write in SQL. The use of “almost” here is because it could potentially be achievable for an SQL expert who is willing to work tirelessly for two days; here’s the code to show you the complexity:
with recursive edates as (
    select min(date(etime)) edate from actions
    union all
    select date_add(edate, interval 1 day) from edates
        where edate<(select max(date(etime)) from actions)
),
users as (
    select distinct userid from actions
),
crox as (
    select u.userid, d.edate, t.edate rdate
    from edates d cross join users u
    left join (select distinct userid, date(etime) edate from actions) t
        on d.edate=t.edate and u.userid=t.userid
),
crox1 as (
    select userid,edate, rdate, row_number() over(partition by userid order by edate) rn,
    case when rdate is null or
        (lag(rdate) over(partition by userid order by edate) is null and rdate is not null)
    then 1 else 0 end f
    from crox
),
crox2 as (
    select userid, edate, rdate,
    cast(rn as decimal) rn, sum(f) over(partition by userid order by edate) g
    from crox1
),
crox3 as (
    select t1.userid, t1.edate, t2.g,  case when count(*)>=3 then 1 else 0 end active3
    from crox2 t1 join crox2 t2
        on t1.userid=t2.userid and t2.rn between t1.rn-6 and t1.rn
    group by t1.userid,t1.edate,t2.g
),
crox4 as (
    select userid, edate, max(active3) active3
    from crox3
    group by userid,edate
)
select edate, sum(active3) active3
from crox4
group by edate;
Do you have the feeling of frustration after reading this code? Is SQL truly suitable for data analysis? What can it actually do?
SQL, as a structured query language, is indeed widely used in many scenarios. SQL is quite simple for simple analytical tasks, which is of course not a problem. However, when facing more complex tasks like those previously mentioned, SQL becomes extremely difficult, and many analysts can’t even work them out in SQL. In other words, when most people use SQL for data analysis, they can only accomplish very simple tasks, and such tasks are often easily handled by BI tools, without needing to write SQL. Therefore, we say that using SQL for data analysis seems to be a false proposition.
To conduct more deeper data analysis, we need to resort to more procedural and flexible programming languages, thus enabling us to handle complex data calculations and deep analysis.
Python doesn’t work well either
Python seems like a good choice and is also widely used. Let’s examine its performance. Here’s the Python code for calculating the next-day retention rate of new users as mentioned above:
df = pd.DataFrame(data)
df['etime'] = pd.to_datetime(df['etime'])
df['edate'] = df['etime'].dt.date
t1 = df.groupby(['userid', 'edate']).size().reset_index(name='count')
t1['rn'] = t1.groupby('userid')['edate'].rank(method='first', ascending=True)
firstday = t1.groupby('userid')['edate'].min().reset_index(name='frst')
retention = pd.merge(firstday, t1, on='userid', how='left')
retention['nxt'] = retention['frst'] + pd.Timedelta(days=1)
retention = retention[retention['edate'] == retention['nxt']]
retention_rate = retention.groupby('frst').apply(
    lambda x: len(x) / len(t1[t1['edate'] == x['frst'].iloc[0]]))
This code is still not very simple because Python doesn’t have grouped subsets either, and you still have to find a workaround. It’s just that because it allows step-by-step processing, it’s a little more convenient and easier to understand compared to SQL.
Is there a simpler one?
SPL is a programming language well-suited for conducting deep data analysis
esProc SPL is a better choice, because it is simple to code and highly interactive.
Simple to code
Let’s look directly at the SPL implementation code.
Calculate the next-day retention rate of new users:
A |
|
1 |
=file("actions.txt").import@t() |
2 |
=A1.groups(userid,date(etime):edate) |
3 |
=A2.group(userid) |
4 |
=A3.new(userid, edate:frst, ~.select@1(edate==frst+1).edate:nxt) |
5 |
=A4.groups(frst ; count(nxt)/count(frst):rate) |

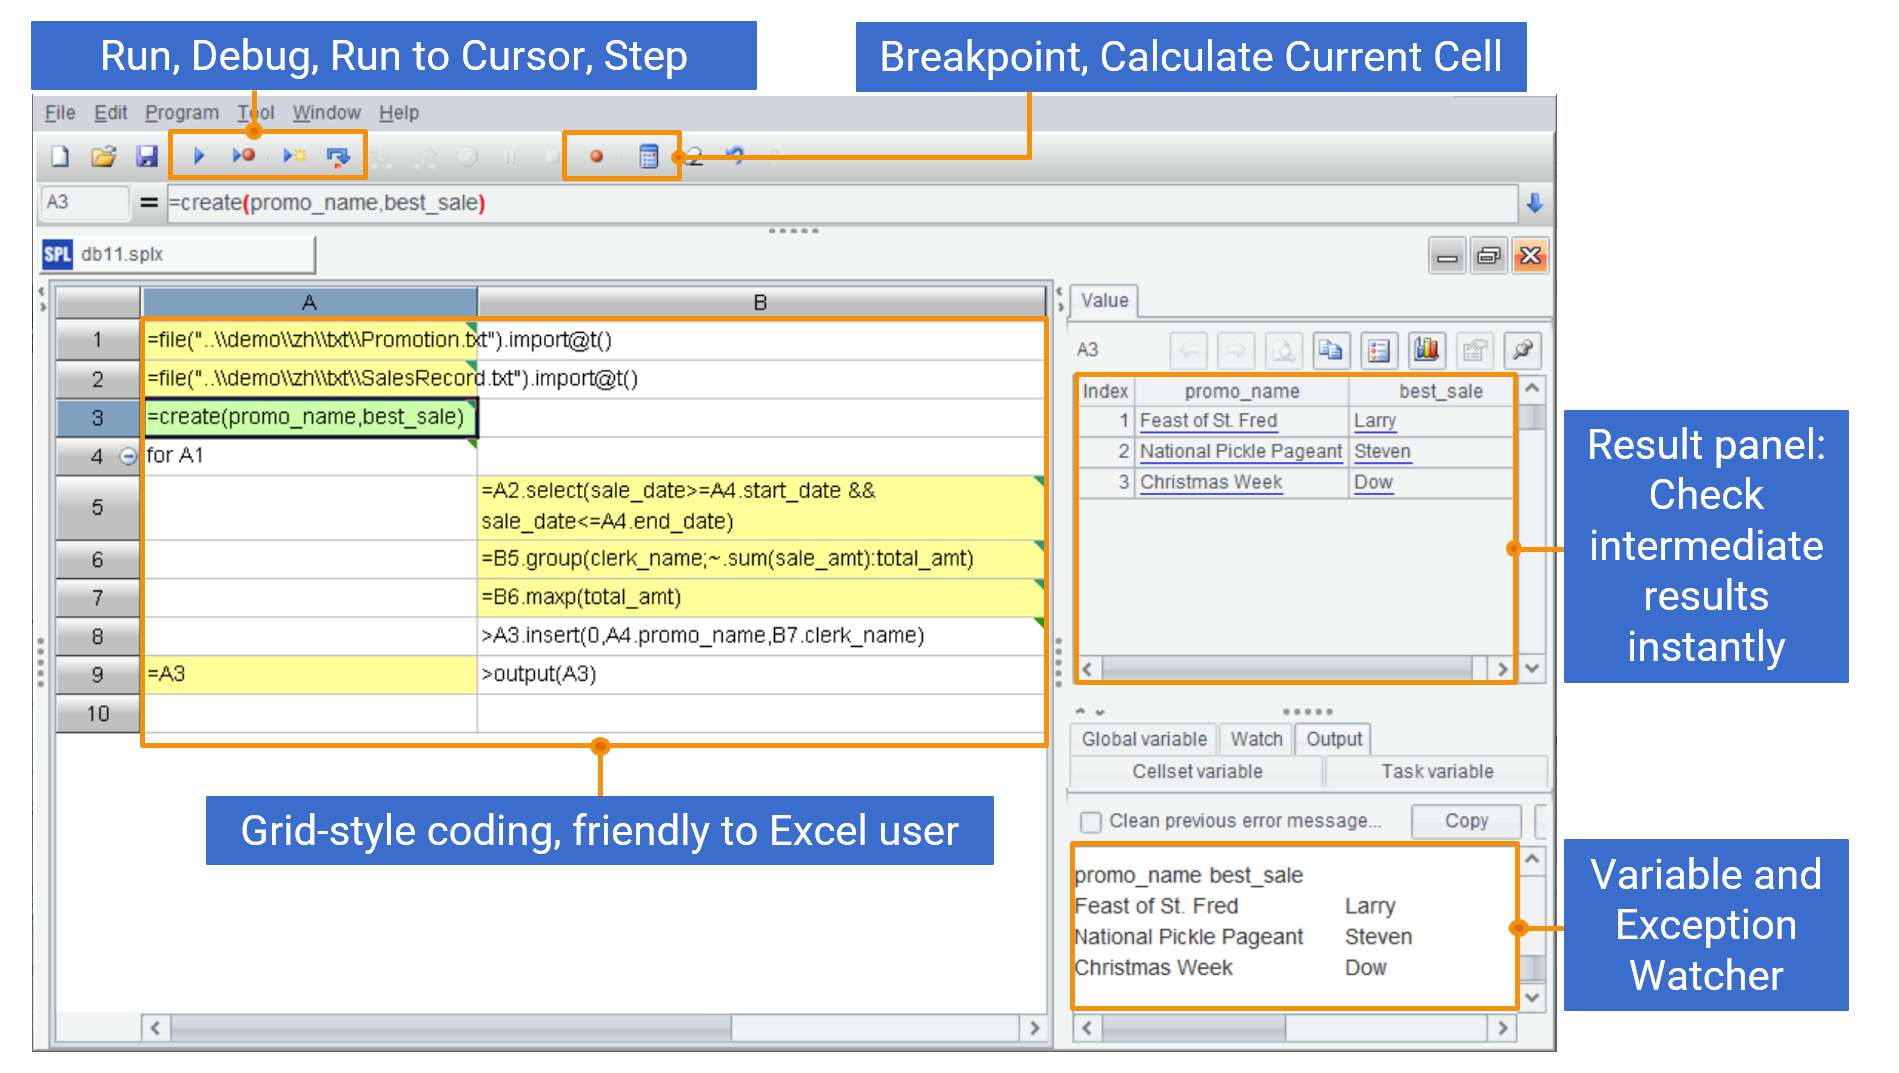
The real-time display of results of each step (or cell) is convenient for viewing and offers high interactivity.
SPL also supports ordered computation, making it very convenient to perform order-related calculations. For example, select@1 in A4 is used to retrieve the first record. Below is a deeper use of ordered computation.
The previously mentioned example that was almost impossible to write in SQL – calculate on a daily basis the number of users who have been continuously active for 3 or more days within the past 7-day period (including the current day) – can still be written relatively easily in SPL:
A |
|
1 |
=file("actions.txt").import@t() |
2 |
=periods(date(A1.min(etime)), date(A1.max(etime))) |
3 |
=A1.group(userid).(~.align(A2,date(etime))) |
4 |
=A3.(~.(~[-6:0].pselect(~&&~[-1]&&~[-2]))) |
5 |
=A2.new(~:date, A4.count(~(A2.#)):count) |
Here, the capabilities of ordered computation are utilized more deeply. For example, A4 uses [] to reference members at adjacent positions, and uses pselect to obtain member positions. Trying to read through this code will further enhance your understanding of SPL’s advantages and ease of use in addressing complex computations.
High interactivity
SPL is not only simple to code, but its IDE, which provides rich debugging features and visual result panel, also surpasses Python and far exceeds SQL in interactivity, making it suitable for data analysis tasks that require exploration.
Comprehensive editing and debugging features
With real-time display of each step’s results, you can adjust immediately if something is wrong.
SQL is convenient for handling simple queries, but its limitations are very obvious when facing complex analysis, making it somewhat cumbersome to use. Python is more flexible, but its coding complexity is still not low. In contrast, SPL has a simple syntax, powerful calculation capabilities, and is more intuitive to operate, making it particularly suitable for handling complex data analysis tasks, especially in scenarios requiring frequent adjustments and exploratory analysis. Therefore, compared to SQL and Python, SPL is a more suitable choice.
SPL Official Website 👉 https://www.scudata.com
SPL Feedback and Help 👉 https://www.reddit.com/r/esProcSPL
SPL Learning Material 👉 https://c.scudata.com
SPL Source Code and Package 👉 https://github.com/SPLWare/esProc
Discord 👉 https://discord.gg/2bkGwqTj
Youtube 👉 https://www.youtube.com/@esProc_SPL


Chinese version