

How to make business predictions based on historical data
The first thing of doing business prediction is to understand what targets are predictable. Here are some examples:
-
To predict the default rate of the borrowers when approving loans;
-
To predict the settlement risk of customers so as to lay down a more flexible insurance premium (the more expensive the insurance premium, the higher the risk associated; and vice versa);
-
To predict the potential clients for certain financial products so as to achieve a more precise marketing result;
-
To predict the operation status of machines in manufacturing industries so as to reduce the unexpected malfunctions;
-
To predict the sales for each type of products, so a supermarket or a department store to stock up on goods properly and precisely;
-
To predict the flow of money lent to enable a proper management of cash flow in the financial and loan businesses.
……
……
We are able to do the predictions as long as we have enough historical data. For example, task1, we discover a pattern from the loan information records in the past years. The information includes the borrowers’ income levels, liabilities, loan amount, term, interest rate, whether or not each payment is made in time, as well as their jobs, residence, transportation habit, etc. Information about defaults is indispensable here. We can match the pattern with a new client to predict the default probability. The prediction cannot be 100% accuracy (we have a lot of matrices to measure the accuracy rate). When there is only one target (one sum of loan, for instance), the prediction will be useless. But generally we always have a great number of targets to be predicted. A certain accuracy rate can be gained even if not every one of the target is accurately predicted. That’s helpful. The potential high-risk clients a model finds may not be actually make defaults, but the result is still useful in preventing risks as long as the accuracy is sufficiently high.
There are 3 phases to do the prediction: 1. Preparation of historical data; 2. Discover a pattern from the data, which we call model building; 3. Data scoring using the model.
1. Preparation of historical data
The historical data is generally displayed in the form of a wide table, as the fowling Excel worksheet shows. We want to predict if users will make default according to some of their basic information.
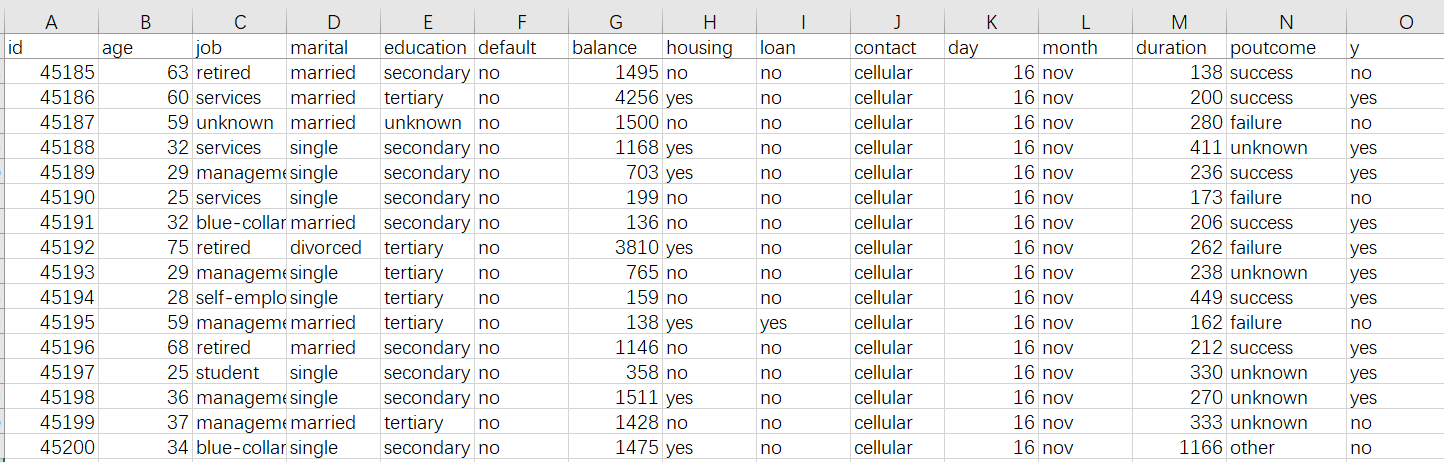
The wide table should include the information we want to predict, which we usually call the prediction target. The prediction target in the above wide table is the information of whether or not a user makes default, which is contain in column y where yes means they have had defaults and no means they haven’t had defaults. The prediction target can be a value, such as the sales quantity, price, etc.; or can be a classification, like excellent, good, standard and poor for assessing the quality of a product. At times the target can be directly referenced from the raw data; other times they need to be specifically commented.
Other relative attributes, such as age, job, house property status and loan, are necessary too. Each column of attribute is called a variable, which possibly affects a user’s payment status. In theory, the more the number of variables, the better. To predict consumer purchase intention towards a product, we can collect their behavior and preferences, as well as the product’s features and promotion information. To predict car accident settlement risk, we need information of insurance policy and the car, the car owner’s transportation habits and the historical settlement records and other information. About settlement risk prediction for health insurance, the insured person’s daily habits, health status and medical records are also required. To predict the sales for a supermarket or a department store, we need historical orders, customer information, and product information. To predict the ratio of defective products, we need to know about the technique parameters, manufacturing environment and the quality of raw materials. In summary, the more relative information we have, the more accurate the prediction.
Generally we use the historical data in a certain time period to create the wide table. To predict the user defaults in July, for example, we can collect data of from January to June to create models. The time range is flexible. You can collect data of the past year or of recent 3 months to do prediction.
A finished wide table should be saved in the CSV format. The first row contains headers and each row after that is a historical record. You can use Excel to save the wide table as CSV file.
If an enterprise has its own data warehouse, the IT department can provide the data a prediction project needs. In many enterprises, their BI system supports exporting the data directly (probably in a different format, but can be converted through Excel).
2. Model building with YModel
After a wide table is ready, we can build models with YModel.
YModel is wonderful convenient data automatic modeling tool intended for data mining novices and ordinary modelers. You can download it in http://www.raqsoft.com/ymodel-download.
(1) Load data
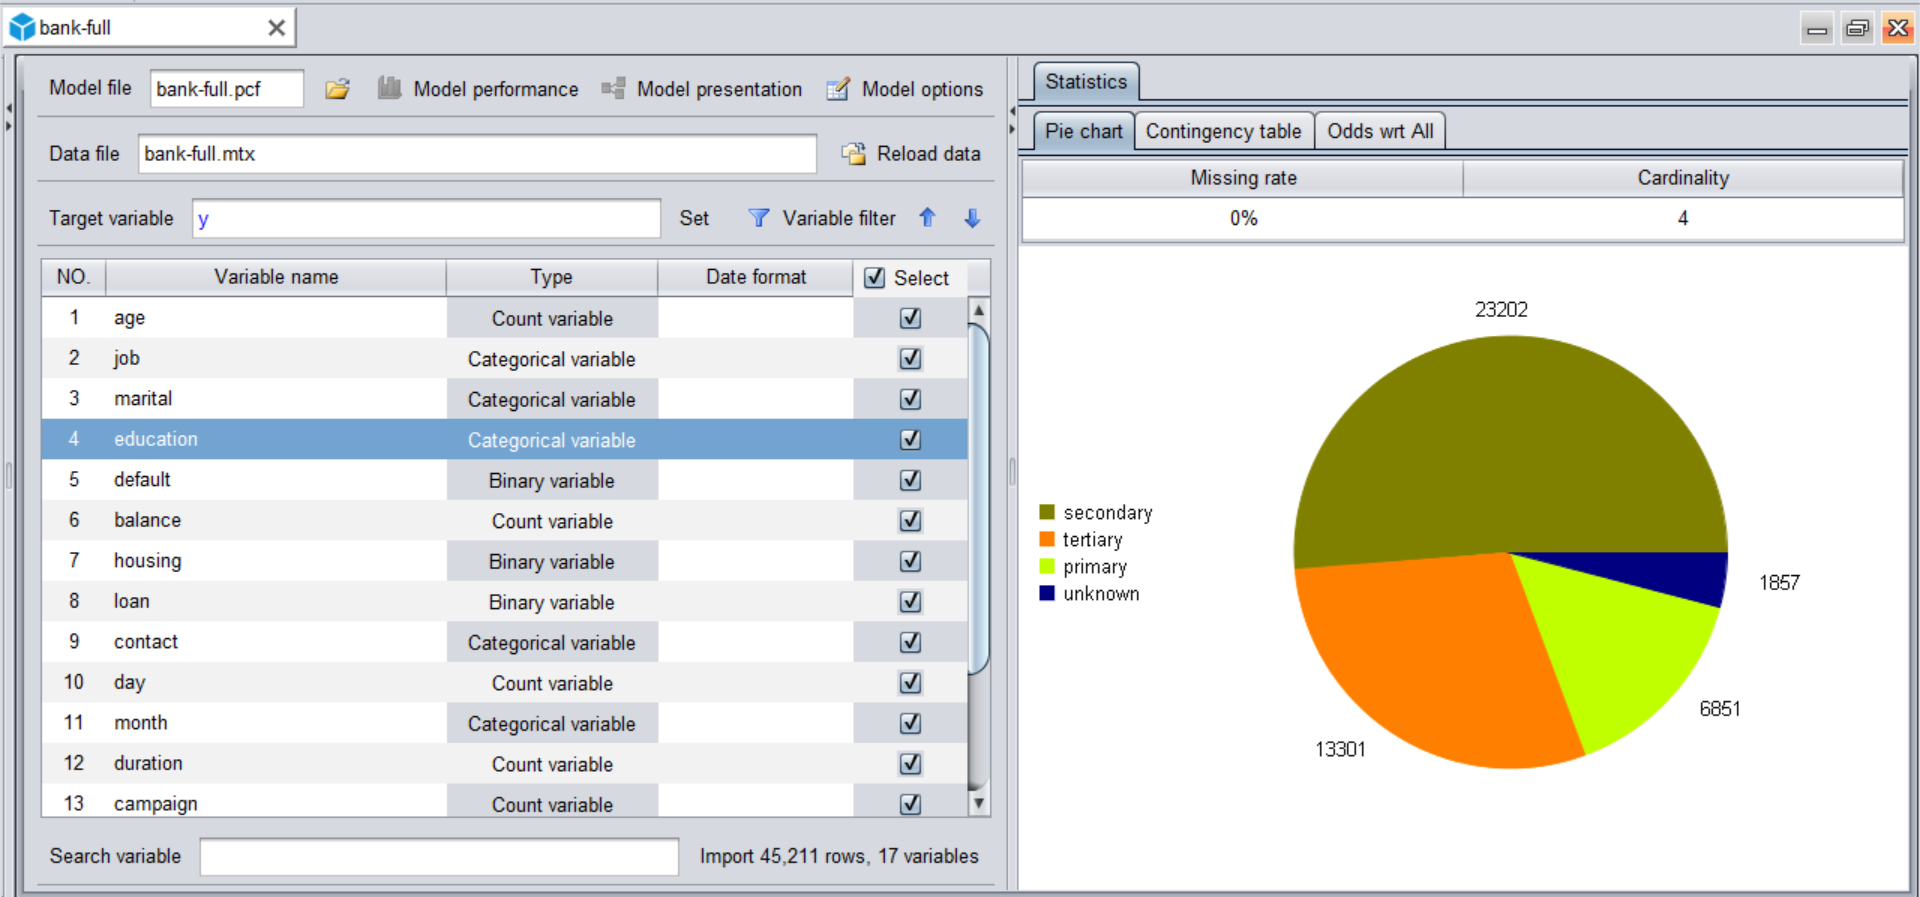
Click on “New model” icon  to import the data (the wide table). YModel will automatically check the data type and calculate various values needed by the mining task.
Sometimes errors happen when you import data for the first time, like messy code, inappropriate datetime format and unrecognized missing values. You just need to return to the data loading window to reconfigure the format and do the loading again. In the following picture, a data preview finds out that “shop_name” column has messy code that is inconsistent with the default character format. In this case you modify the configuration of character format and all will be normal.


(2) Set target variable
After data is loaded, we set to configure the prediction target, which we call target variable.

(3) Build model
Now we just click on the “Modeling” icon  to begin model building. The whole process of data preprocessing and model building is completely autonomous.


The model will be ready after several or dozens of minutes, or even shorter, according to the data size. The importance degrees of all variable will be automatically shown. Variables listed in the top positions have greater impact on the result. The feature can help do some business analyses. When the target variable is the sales, for instance, we can identify the important factors that have more impact on it.

After a model is built, the tool will automatically output a model file with the .pcf extension for data scoring. If you want to save the model building process, just click on the “Save” icon  to generate a modeling file with the .mtx extension. A pcf file contains only the model without data, and an mtx file contains data and model configurations.
3. Data scoring with YModel
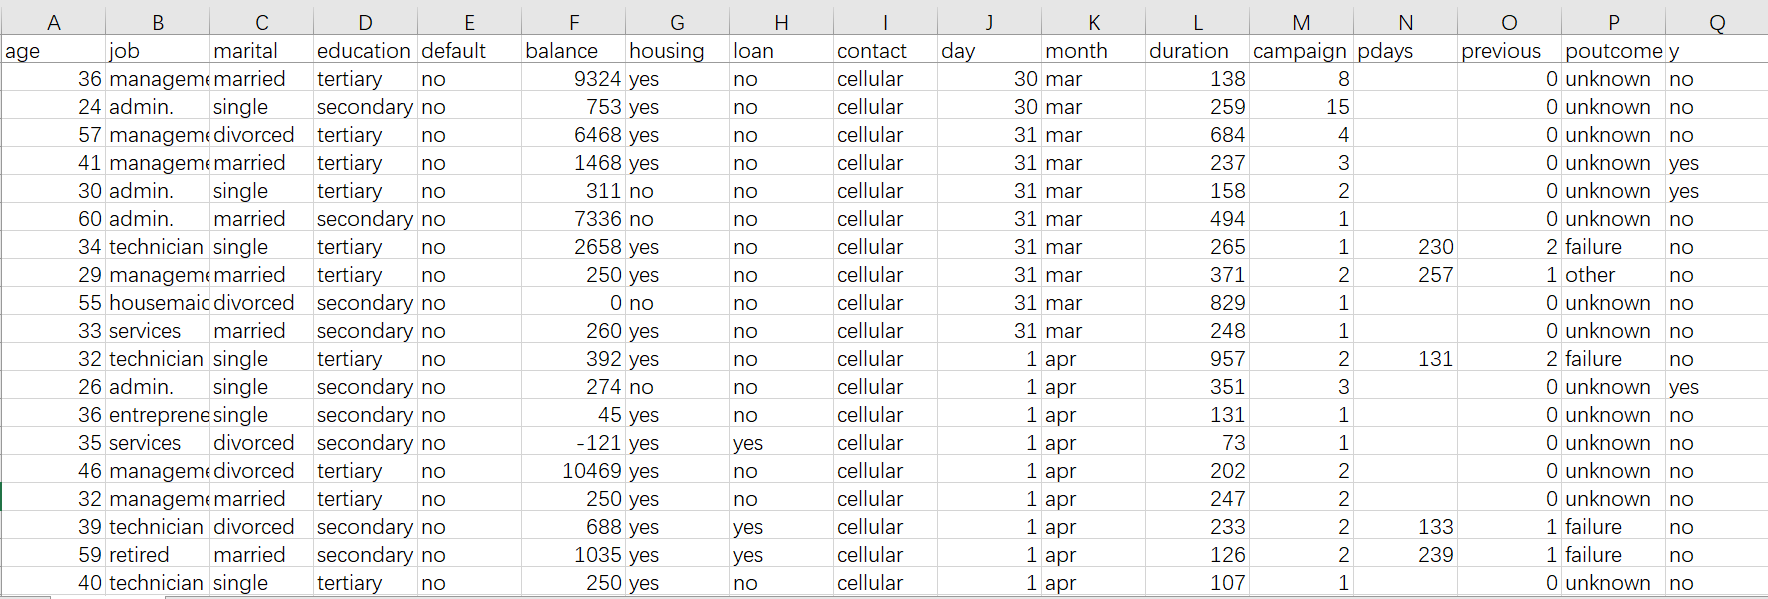
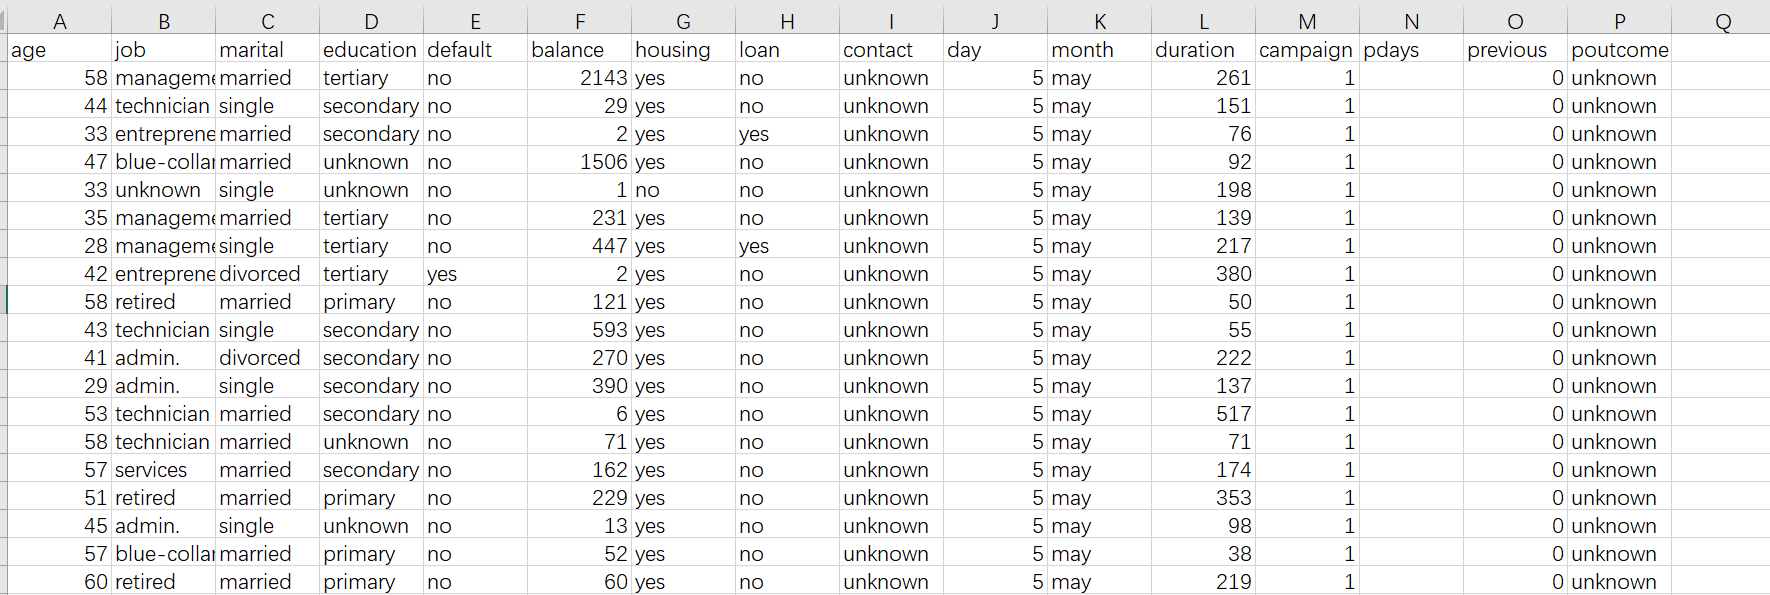
Click on the “Scoring” icon  on the top left of the YModel screen to open the pcf model file and load the data set to be predicted. The data set should be the CSV format and remain consistent with the format of the variable (a column in the original CSV file, but without the target variable). In the following picture, one has the y column and the other hasn’t.
After the target data set is loaded, click on the “Scoring” icon on the top right of the screen to do the scoring. The following shows the screen after data scoring is completed. The leftmost column contains the scoring result. Here percentages are used to represent the default rates. The bigger a percentage, the higher the probability they make a default. We can define a threshold value for the high-risk clients (Mostly the value is defined according to business experience. For beginners, they can just make it 50%).

The above result can be exported as a file of multiple formats, such as CSV and XLS.
Now the prediction work is finished. The whole process is easy.
4. Model performance
How can we know the accuracy of the prediction?
In the second phase when model is built, you can click on “Model performance” icon  to check information about the models, which we call model performance, as shown below:

Generally we judge the accuracy according to AUC result, whose value range is 0.5-1. Theoretically, a larger AUC value means reflect a more accurate model. Here the model’s AUC is 0.89. This means it is a rather good model. It is highly reliable when used to do the scoring. One thing to note is that the 0.89 doesn’t means that the accuracy rate is 89% (the accuracy rate keeps in with the threshold value and can’t be calculated before the threshold is defined). AUC is more complicated. You can read the free, easy to understand e-book in http://www.raqsoft.com/html/course-data-mining.html to learn more about it.
But is a model the best if the AUC is nearly 1? The answer is no. Because may be there is overfitting. The overfitting means that the AUC is very high but the accuracy rate is very low. The above e-book also explains why does overfitting happen and how to identify and avoid it.
Summary:
Here’s the commercial data mining workflow:
-
Create wide tables based respectively on historical data and data set to be predicted. The historical data must contain the target variable and the to-be-predicted data set won’t have it.
-
Load the historical data to YModel to create model(s) and generate the model file with the extension of .pcf.
-
Open the pcf model file, load the to-be-predicted data set to do the data scoring and generate the result. Then you can make a commercial decision according to the result (such as the default rate).
SPL Official Website 👉 http://www.scudata.com
SPL Feedback and Help 👉 https://www.reddit.com/r/esProc
SPL Learning Material 👉 http://c.scudata.com
SPL Source Code and Package 👉 https://github.com/SPLWare/esProc
Discord 👉 https://discord.gg/ydhVnFH9
Youtube 👉 https://www.youtube.com/@esProc_SPL


Chinese version