What should I do when the data source in the Java report tool cannot be calculated by SQL?
To other questions:
How to handle multi-source calculations in Java reporting tools?
What should I do when it is difficult to write complex SQL in Java reporting tools?
Solution: esProc – the professional computational package for Java
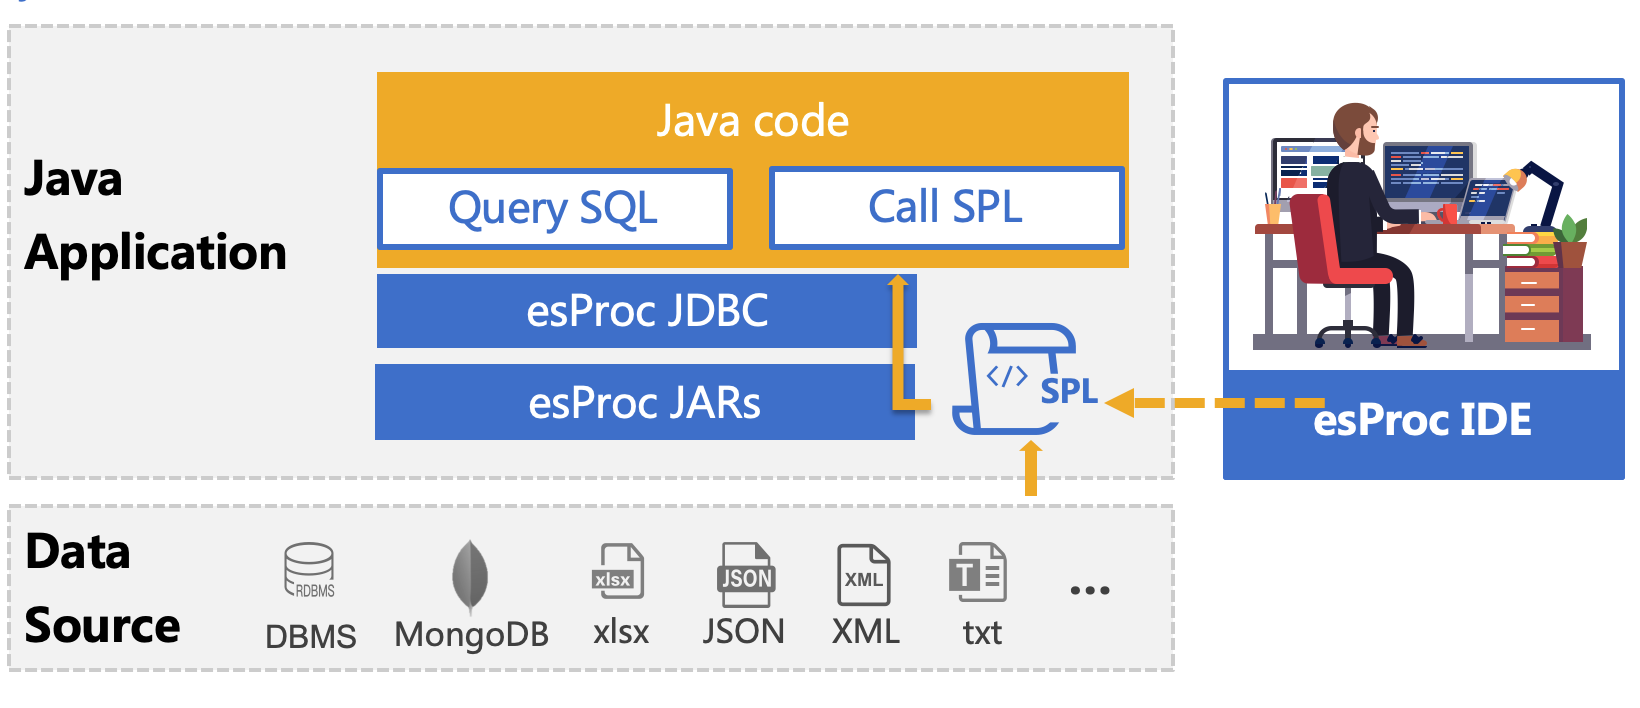
esProc is a class library dedicated to Java-based calculations and aims to simplify Java code. SPL is a scripting language based on the esProc computing package. It can be deployed together with Java programs and understood as a stored procedure outside the database. Its usage is the same as calling a stored procedure in a Java program. It is passed to the Java program for execution through the JDBC interface, realizing step-by-step structured computing, return the ResultSet object.
The data source of today’s reporting tools comes from the database and a text file, a JSON file, or an XML file. These non-database data sources haven’t the computational power to handle the necessary operations, such as filtering, grouping, and multi-table joins, for creating some reports. Reporting tools also have trouble handling JSON and XML data due to their inadequate capability. Even with the structured files on which they can perform the basic handling, reporting tools have capacity overloading. So usually, you need to import the non-database data to a database before you begin the real work of report development, creating an extra workload.
esProc can use these non-database data sources directly in data preparation for report development, saving the trouble of importing data into the database and reducing the workload. esProc’s computing capabilities can enable these diverse data with different computing capabilities to obtain universal and consistent computing capabilities.
Text data source
Most report tools can import structured text for calculations such as column calculations, grouping, and sorting. However, the report tool writes all calculation expressions on the report layout. When the calculation dependency is complicated or in multiple steps, it is often necessary to use hidden grids, making it difficult to understand the calculation target at a glance. If you can use esProc, it will be much easier. Data preparation is in a special computing unit. Reports are only responsible for the presentation and a small number of intuitive calculations, and the application structure is clearer. First, give a simple example, and then introduce how to use it with the report tool.
For example: find classes with an average English score of less than 70.
A |
|
1 |
=T(“E:/txt/Students_scores.txt”) |
2 |
=A1.groups(CLASS;avg(English):avg_En) |
3 |
=A2.select(avg_En<70) |
The integration of SPL and Java report development tools is also very simple. Take Vertica as the data source and Birt as the reporting tool as an example. Copy the esProc core jar package and the corresponding database driver jar package to the Birt development environment [installation directory]\plugins\org.eclipse.birt.report.data.oda.jdbc_4.6.0.v20160607212 (different Birt versions are slightly different) .
Create a new report in the Birt development tool and add the esProc data source “esProcConnection”

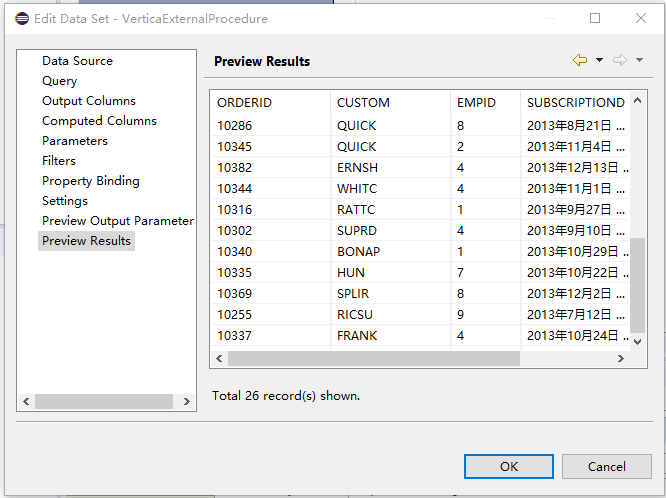
Birt calls the Vertica external stored procedure (esProc data set). Create a new “Data Sets”, select the configured esProc data source (esProcConnection), and select the data set type to select a stored procedure (SQL Stored Procedure Query).

Query Text input: {call VerticaExternalProcedures()}, where VerticaExternalProcedures is the SPL script file name

Finish, preview the data (Preview Results)
For more Java report integration details, please refer to: How to Call an SPL Script in BIRT and How to Call an SPL Script in JasperReport
Use SPL to realize multi-text association calculation:
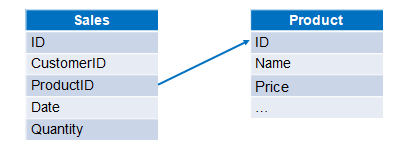
For example, the sales order and product are stored in two text files, respectively, and calculate the sales amount of each order. The data structure of the two files is as follows:
A |
|
1 |
=T(“e:/orders/sales.csv”) |
2 |
=T(“e:/orders/product.csv”).keys(ID) |
3 |
=A1.join(ProductID,A2,Name,Price) |
4 |
=A3.derive(Quantity*Price:amount) |
There are many texts of the same structure in a directory, and the query summary after merging with SPL is also very simple:
| A | |
| 1 | =directory@p("./"+user+"/*.csv") |
| 2 | =A1.conj(file(~).import@tc()) |
| 3 | =A2.groups('Customer ID':CID,year('Purchase Date'):Year; 'Customer Name':Customer,sum('Sale Amount'):Total,round(avg('Sale Amount'),1):Average) |
| 4 | =A3.select(Year==when).new(Customer,Total,Average) |
SPL provides a complete method of querying file data with SQL:
For example, State, Department, and Employee are stored in 3 text files respectively, query employees in New York state whose manager is in California.
A |
|
1 |
$select e.NAME as ENAME from E:/txt/EMPLOYEE.txt as e join E:/txt/DEPARTMENT.txt as d on e.DEPT=d.NAME join E:/txt/EMPLOYEE.txt as emp on d.MANAGER=emp.EID where e.STATE='New York' and emp.STATE='California' |
Excel data source
There are comprehensive Excel file processing functions in SPL, which is very convenient for structured analysis and subsequent calculations. For example, to use SPL to read Excel data for a conditional query, write two lines of code:
A |
|
1 |
=file("simple.xls").xlsimport@t() |
2 |
=A1.select(amount>500 && amount<=2000) |
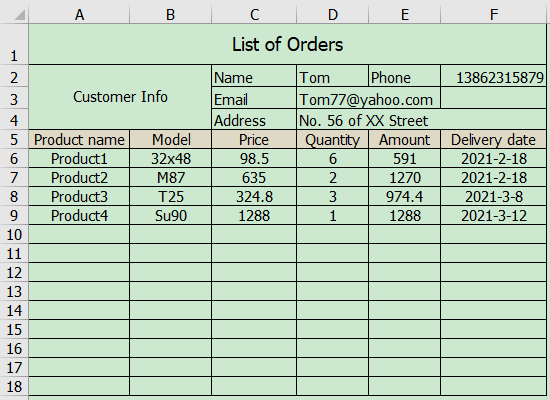
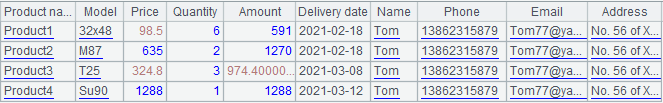
Some Excel files’ format is not regular, extracting data programming structure is very hard. For example, attach the main table information to each sub-table record, and the data in the order detail list order.xlsx is as shown in the figure below:
Use SPL as follows:
A |
|
1 |
=file("E:/work/order.xlsx").xlsopen() |
2 |
=A1.xlsimport@t(;1,5).select(Model) |
3 |
=A2.derive(A1.xlscell("D2"):Name,A1.xlscell("F2"):Phone,A1.xlscell("D3"):Email,A1.xlscell("D4"):Address) |
A1 Open the order.xlsx file as an Excel object
A2 Read the row data starting from row 5 in the first sheet of A1, and filter out rows where Model is empty. The option @t means that the first row is column headings
A3 Add 4 columns to A2: The value of the Name column is the content of cell D2, the value of the Phone column is the content of cell F2, the value of the Email column is the content of cell D3, and the value of the Address column is the content of cell D4.
The final result of cell A3 is shown in the figure below:
Json data source
The data sets in the general report tools are similar to the single-layer two-dimensional tables returned by SQL. Suppose you encounter multi-layer data such as Json or XML. In that case, you first need to convert them into multiple single-layer data sets and then associate them into multi-level reports. The SPL can directly support the calculation of multi-layer data sets. This conversion is not required and reduces the workload. The report can also accept the multi-layer data set returned by the SPL to be presented directly in layers without the need to make further associations in the report.
The file EO.json stores a batch of employee information and multiple orders belonging to employees. Some of the data is as follows:
[{
      "_id": {"$oid":   "6074f6c7e85e8d46400dc4a7"},
      "EId": 7,"State":   "Illinois","Dept": "Sales","Name":   "Alexis","Gender": "F","Salary":   9000,"Birthday": "1972-08-16",
      "Orders": [
         {"OrderID":   70,"Client": "DSG","SellerId":   7,"Amount": 288,"OrderDate": "2009-09-30"},
         {"OrderID":   131,"Client": "FOL","SellerId":   7,"Amount": 103.2,"OrderDate": "2009-12-10"}
    ]
}
{
      "_id": {"$oid":   "6074f6c7e85e8d46400dc4a8"},
      "EId": 8,"State": "California", ...
}]
Query with SPL as follows:
A |
|
1 |
=json(file("D:\\data\\EO.json").read()) |
2 |
=A1.conj(Orders) |
3 |
=A2.select(Amount>500 && Amount<=2000 && like@c(Client,"*bro*")) |
The above code first reads Json as a multi-layered table sequence object, then uses the conj function to merge all orders, and then uses the select function to complete the conditional query.
Json data is often the data returned by REST API. For example, some of the data formats are as follows:
[
    {
        "id": 1000,
        "content": "It is too hot",
        "comment": [
            {
                "author": "joe",
                "score": 3,
                "comment": "just so so!"
            },
            {
                "author": "jimmy",
                "score": 5,
                "comment": "cool! good!"
            }
        ]
}
...
]
Using SPL to parse the REST API as follows:
| A | |
|---|---|
| 1 | =httpfile(“http://yourapi/endpoint/servlet/testServlet?table=blog&type=json”) |
| 2 | =json(file(A1).read()) |
| 3 | =A2.news(comment;id,content,${A2.comment.fname().concat@c()}) |
The results after parsing are as follows: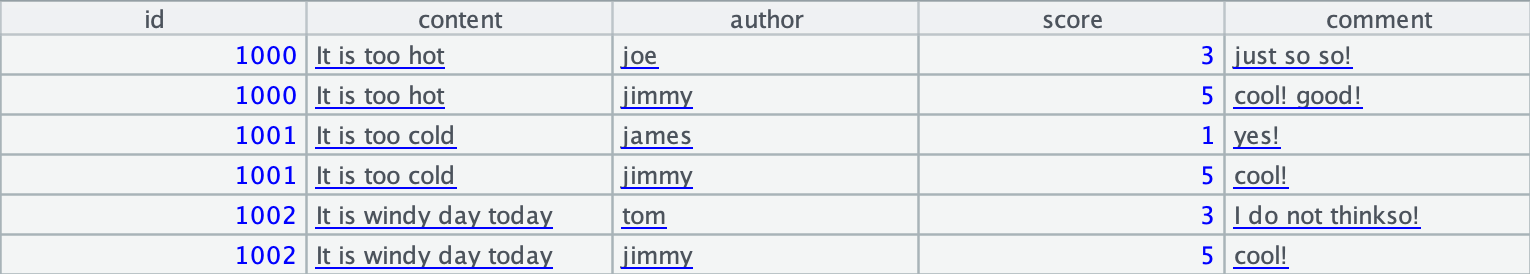
XML data source
The file Employees_Orders.xml stores a batch of employee information and multiple orders belonging to employees. Part of the data is as follows:
<?xml version="1.0"   encoding="UTF-8"?>
<xml>
<row>
         <EId>2</EId>
         <State>"New   York"</State>
         <Dept>"Finance"</Dept>
         <Name>"Ashley"</Name>
         <Gender>"F"</Gender>
         <Salary>11000</Salary>
         <Birthday>"1980-07-19"</Birthday>
<Orders>[]</Orders>
</row>
<row>
         <EId>3</EId>
         <State>"New   Mexico"</State>
         <Dept>"Sales"</Dept>
         <Name>"Rachel"</Name>
         <Gender>"F"</Gender>
         <Salary>9000</Salary>
         <Birthday>"1970-12-17"</Birthday>
         <Orders>
                  <OrderID>32</OrderID>
                  <Client>"JFS"</Client>
                  <SellerId>3</SellerId>
                  <Amount>468.0</Amount>
                  <OrderDate>"2009-08-13"</OrderDate>
         </Orders>
         <Orders>
                  <OrderID>39</OrderID>
                  <Client>"NR"</Client>
                  <SellerId>3</SellerId>
                  <Amount>3016.0</Amount>
                  <OrderDate>"2010-08-21"</OrderDate>
                  </Orders>
         <Orders>
</row>
…
<xml>
Using SPL to parse as follows:
A |
|
1 |
=xml(file("D:\\xml\\Employees_Orders.xml").read(),"xml/row") |
2 |
=A1.conj(Orders) |
3 |
=A2.select(Amount>100 && Amount<=3000 && like@c(Client,"*bro*")) |
The above code first reads the XML as a multi-layered table sequence object, then uses the conj function to merge all orders, and then uses the select function to complete the conditional query.
MongoDB data source
esProc is a professional structured calculation engine that can calculate various NoSQL data sources with unified syntax and data structure, including MongoDB. For example, the conditional query SPL code for multi-layer collection is as follows:
A |
|
1 |
=mongo_open("mongodb://127.0.0.1:27017/mongo") |
2 |
=mongo_shell(A1,"test1.find()") |
3 |
=A2.conj(Orders) |
4 |
=A3.select(Amount>1000 && Amount<=3000 && like@c(Client,"*s*")).fetch() |
5 |
=mongo_close(A1) |
As can be seen from A2, esProc supports MongoDB’s json query expressions (find, count, distinct and aggregate), such as interval query writing: =mongo_shell(A2,“test1.find({Orders.Amount:{$gt:1000, $lt:3000}})”).
Similarly, the grouping summary code is as follows:
A |
|
1 |
=mongo_open("mongodb://127.0.0.1:27017/mongo") |
2 |
=mongo_shell(A1,"test1.find()") |
3 |
=A2.conj(Orders).groups(year(OrderDate);sum(Amount)) |
4 |
=mongo_close(A1) |
The associated query code is as follows:
A |
|
1 |
=mongo_open("mongodb://127.0.0.1:27017/mongo") |
2 |
=mongo_shell(A1,"test1.find()") |
3 |
=A2.new(Orders.OrderID,Orders.Client, Name,Gender,Dept).fetch() |
4 |
=mongo_close(A1) |
More data sources
In addition to the above data sources, esProc can also access ElasticSearch, Spark, HBase, Redis, Cassandra, SAP, Kafka, HDFS file systems, etc.
For details on deployment and connection esProc External Library
SPL Official Website 👉 http://www.scudata.com
SPL Feedback and Help 👉 https://www.reddit.com/r/esProc
SPL Learning Material 👉 http://c.scudata.com
SPL Source Code and Package 👉 https://github.com/SPLWare/esProc
Discord 👉 https://discord.gg/ydhVnFH9
Youtube 👉 https://www.youtube.com/@esProc_SPL