

SPL: grouping and sorting aligned by a specified criterion
Grouping often requires the result set to appear in the order of a criterion set, and this kind of alignment groups are quite common in everyday statistics. For example, according to the order of Beijing, Shanghai, Guangzhou, and Shenzhen, calculate the total sales of a company in these cities; according to the specified department order, query the average salary of each department, and so on.
This kind of grouping is called alignment grouping. Aligned groups may have empty groups or members that are not assigned to any of the groups.
1. Sorting by the specified criterion set
The data is sorted in the order of the fields specified in the criterion table, and every group will retain up to one matching member per group. It is applicable to situations where we want to query or use the data in a specified order.
[e.g. 1] According to the GDP table of Chinese cities in a given year, query the GDP and population of these first-tier cities in the order of Beijing, Shanghai, Guangzhou and Shenzhen. Some of the data are as follows:
ID |
CITY |
GDP |
POPULATION |
1 |
Shanghai |
32679 |
2418 |
2 |
Beijing |
30320 |
2171 |
3 |
Shenzhen |
24691 |
1253 |
4 |
Guangzhou |
23000 |
1450 |
5 |
Chongqing |
20363 |
3372 |
… |
… |
… |
… |
The A.align() function in SPL is used to align the groups and retain up to one matching member per group by default.
The SPL script looks like this:
A |
|
1 |
=T("CityGDP.txt") |
2 |
["Beijing","Shanghai","Guangzhou","Shenzhen"] |
3 |
=A1.align(A2,CITY) |
4 |
=A3.new(CITY,GDP,POPULATION) |
A1: query the city GDP table.
A2: define the sequence of cities.
A3: use the A.align() function to sort the city GDP table by a specified sequence of cities, and retain up to one matching member per group.
A4: create a result table with cities, GDP, and population as fields.
The execution results of A4 are as follows:
CITY |
GDP |
POPULATION |
Beijing |
30320 |
2171 |
Shanghai |
32679 |
2418 |
Guangzhou |
23000 |
1450 |
Shenzhen |
24691 |
1253 |
2. Retaining all matching members in each group
The data is grouped in the order of the fields specified in the criterion table, and each group retain all matching members. This is applicable to situations where we care about the information of members in each group, or where we need to continue calculating with these member records.
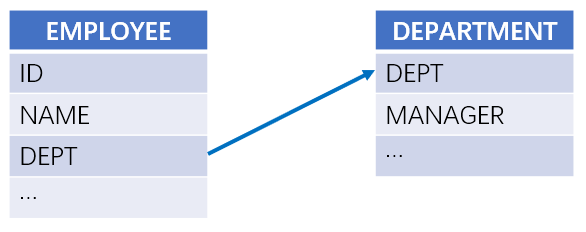
[e.g. 2] According to the interrelated employee table and department table, the number of each department is calculated in the order of the departments in the department table. The relationship between the employee table and the department table is as follows:
The option @a of A.align() function in SPL is used to keep all matching members in each group while aligning the groups.
The SPL script looks like this:
A |
|
1 |
=connect("db") |
2 |
=A1.query("select * from EMPLOYEE") |
3 |
=A1.query("select * from DEPARTMENT") |
4 |
=A2.align@a(A3:DEPT, DEPT) |
5 |
=A3.new(DEPT, A4(#).count():COUNT) |
A1: connect to the database.
A2: query the employee table.
A3: query the department table.
A4: use the A.align@a() function to align employees by department, with the option @a returning all matching members of each group.
A5: create a result sequence based on the department table and calculate the number of each group, which is the number of people in each department, based on the results of the A4 alignment grouping.
The execution results of A5 are as follows:
DEPT |
COUNT |
Administration |
4 |
Finance |
24 |
HR |
19 |
… |
… |
The alignment grouping may have empty groups, which means that none of the member is assigned to the subgroup.
3. Placing the mismatching records in a new group
The data is grouped in the order of the fields specified in the criterion table, and create a new group for mismatching records. This is applicable to situations where we care not only about the information of matching member, but also about other mismatching records.
[e.g. 4] According to the employee table, calculate the average wages of [California, Texas, New York, Florida], with other states as a “Other” group. Some data of the employee table are as follows:
ID |
NAME |
STATE |
DEPT |
SALARY |
1 |
Rebecca |
California |
R&D |
7000 |
2 |
Ashley |
New York |
Finance |
11000 |
3 |
Rachel |
New Mexico |
Sales |
9000 |
4 |
Emily |
Texas |
HR |
7000 |
5 |
Ashley |
Texas |
R&D |
16000 |
… |
… |
… |
… |
… |
The option @n of the A.align() function in SPL is used to put the mismatching records into a new group while aligning the group.
The SPL script looks like this:
A |
|
1 |
=T("Employee.csv") |
2 |
[California,Texas,New York,Florida] |
3 |
=A1.align@an(A2,STATE) |
4 |
=A3.new(if (#>A2.len(),"Other",STATE):STATE,~.avg(SALARY):AvgSalary) |
A1: query the employee table.
A2: create a sequence of region.
A3: use the A.align@an() function to group employee tables by region, with the option @a returning all matching members of each group, and the option @n saving the mismatching members in the new group.
A4: calculate the average salary of each group, and name the mismatching group (the last group) as “Other”.
The execution results of A4 are as follows:
STATE |
AvgSalary |
California |
7700.0 |
Texas |
7592.59 |
New York |
7677.77 |
Florida |
7145.16 |
Other |
7308.1 |
SPL Official Website 👉 http://www.scudata.com
SPL Feedback and Help 👉 https://www.reddit.com/r/esProc
SPL Learning Material 👉 http://c.scudata.com
SPL Source Code and Package 👉 https://github.com/SPLWare/esProc
Discord 👉 https://discord.gg/ydhVnFH9
Youtube 👉 https://www.youtube.com/@esProc_SPL

