

Correlation matrix
The correlation matrix reflects the correlation between the two variables, and generally calculates the Pearson correlation coefficient. In the following table, there are four variables x1, x2, x3 and x4, and their correlation coefficient matrix is calculated to evaluate the correlation of variables.
x1 |
x2 |
x3 |
x4 |
|
1 |
7 |
26 |
6 |
60 |
2 |
1 |
29 |
15 |
52 |
3 |
11 |
56 |
8 |
20 |
4 |
11 |
31 |
8 |
47 |
5 |
7 |
52 |
6 |
33 |
6 |
11 |
55 |
9 |
22 |
SPL code:
A |
B |
|
1 |
[[7,26,6,60],[1,29,15,52],[11,56,8,20],[11,31,8,47],[7,52,6,33],[11,55,9,22],[3,71,17,6],[1,31,22,44],[2,54,18,22],[21,47,4,26],[1,40,23,34],[11,66,9,12],[10,68,8,12]] |
[[x1,x2,x3,x4]] |
2 |
=transpose(A1) |
|
3 |
for A2 |
=A2.(pearson(A3,~)) |
4 |
||
5 |
=transpose(B1) |
|
6 |
=[B1(1).insert(1,"")]|A5 |
A1 Input the sample data
B1 Define a sequence and store the result of the calculation
A2 Transpose A1
A3:B4 Loop A2 to calculate the correlation coefficient between the two variables and store the results in B1
A5 Transpose B1
A6 Add variable name
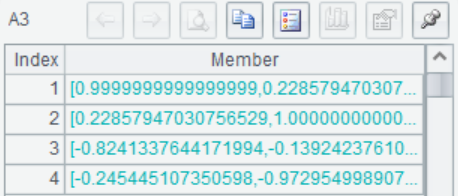
After the above code is executed, the correlation coefficient matrix can be generated in the following table:
x1 |
x2 |
x3 |
x4 |
|
x1 |
1 |
0.228579 |
-0.82413 |
-0.24545 |
x2 |
0.228579 |
1 |
-0.13924 |
-0.97295 |
x3 |
-0.82413 |
-0.13924 |
1 |
0.029537 |
x4 |
-0.24545 |
-0.97295 |
0.029537 |
1 |
In addition to the above methods, the correlation matrix can also be obtained by calculating the normalized covariance matrix.
A |
|
1 |
[[7,26,6,60],[1,29,15,52],[11,56,8,20],[11,31,8,47],[7,52,6,33],[11,55,9,22],[3,71,17,6],[1,31,22,44],[2,54,18,22],[21,47,4,26],[1,40,23,34],[11,66,9,12],[10,68,8,12]] |
2 |
=mnorm@s(A1,1) |
3 |
=covm(A2) |
A2 A1 is normalized by column with a center value of 0 and a standard deviation of 1. @s indicates a statistical calculation divided by n-1
A3 The covariance matrix is calculated and the result is the correlation coefficient matrix.
SPL Official Website 👉 http://www.scudata.com
SPL Feedback and Help 👉 https://www.reddit.com/r/esProc
SPL Learning Material 👉 http://c.scudata.com
SPL Source Code and Package 👉 https://github.com/SPLWare/esProc
Discord 👉 https://discord.gg/ydhVnFH9
Youtube 👉 https://www.youtube.com/@esProc_SPL

