

Hypothesis testing of regression model
In the multiple linear regression model, whether there is a linear relationship between the dependent variable y and the independent variable 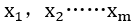 and the significance of the regression coefficient both need to be tested. For example, in the following case, we can analyze the relationship between independent variables and dependent variables through F test and t test.
There are the data of 4 carcass traits of 25 finishing pigs in a pig farm. It is necessary to conduct multiple regression analysis of lean meat weight y on eye muscle area x1, leg meat weight x2 and loin meat weight x3.
NO. |
eye muscle area x1 |
leg meat weight x2 |
loin meat weight x3 |
lean meat weight y |
1 |
23.73 |
5.49 |
1.21 |
15.02 |
2 |
22.34 |
4.32 |
1.35 |
12.62 |
3 |
28.84 |
5.04 |
1.92 |
14.86 |
4 |
27.67 |
4.72 |
1.49 |
13.98 |
5 |
20.83 |
5.35 |
1.56 |
15.91 |
6 |
22.27 |
4.27 |
1.5 |
12.47 |
7 |
27.57 |
5.25 |
1.85 |
15.8 |
8 |
28.01 |
4.62 |
1.51 |
14.32 |
9 |
24.79 |
4.42 |
1.46 |
13.76 |
10 |
28.96 |
5.3 |
1.66 |
15.18 |
11 |
25.77 |
4.87 |
1.64 |
14.2 |
12 |
23.17 |
5.8 |
1.9 |
17.07 |
13 |
28.57 |
5.22 |
1.66 |
15.4 |
14 |
23.52 |
5.18 |
1.98 |
15.94 |
15 |
21.86 |
4.86 |
1.59 |
14.33 |
16 |
28.95 |
5.18 |
1.37 |
15.11 |
17 |
24.53 |
4.88 |
1.39 |
13.81 |
18 |
27.65 |
5.02 |
1.66 |
15.58 |
19 |
27.29 |
5.55 |
1.7 |
15.85 |
20 |
29.07 |
5.26 |
1.82 |
15.28 |
21 |
32.47 |
5.18 |
1.75 |
16.4 |
22 |
29.65 |
5.08 |
1.7 |
15.02 |
23 |
22.11 |
4.9 |
1.81 |
15.73 |
24 |
22.43 |
4.65 |
1.82 |
14.75 |
25 |
20.04 |
5.08 |
1.53 |
14.35 |
Requirement:
(1) Build a linear regression equation of y with respect to x1, x2, x3
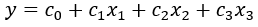
Calculate the estimates for 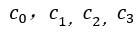
(2) Test the regression model and regression coefficient and the significance level a was 0.05.
Analysis:
(1)Linear regression can be fitted using the least square method, using linefit(), which returns the fitting regression coefficients
(2)Use F-test to test whether there is a linear relationship between y and x1,x2,x3. If the test is passed, then continue to use t-test to test the significance of the regression coefficient. The statistics to be calculated are: F,
Formulas:
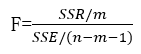
m represents numerator degree of freedom and n represents the number of samples
Regression Sum of Squares: 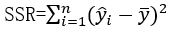
Residual Sum of Squares: 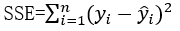
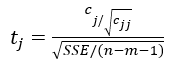
Where  is the (j+1, j+1) element in
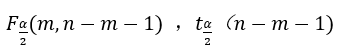 can be calculated by using the inverse cumulative functions finv()and tinv()
Calculation with SPL:
(1) Use least square method to fit the regression equations
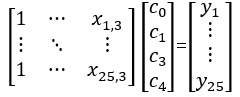
Solve the estimates for
A |
B |
C |
D |
|
1 |
[[1,23.73,5.49,1.21],[1,22.34,4.32,1.35],[1,28.84,5.04,1.92],[1,27.67,4.72,1.49], [1,20.83,5.35,1.56],[1,22.27,4.27,1.5],[1,27.57,5.25,1.85],[1,28.01,4.62,1.51], [1,24.79,4.42,1.46],[1,28.96,5.3,1.66],[1,25.77,4.87,1.64],[1,23.17,5.8,1.9], [1,28.57,5.22,1.66],[1,23.52,5.18,1.98],[1,21.86,4.86,1.59],[1,28.95,5.18,1.37], [1,24.53,4.88,1.39],[1,27.65,5.02,1.66],[1,27.29,5.55,1.7],[1,29.07,5.26,1.82], [1,32.47,5.18,1.75],[1,29.65,5.08,1.7],[1,22.11,4.9,1.81],[1,22.43,4.65,1.82], [1,20.04,5.08,1.53]] |
3 |
25 |
0.05 |
2 |
[15.02,12.62,14.86,13.98,15.91,12.47,15.8,14.32,13.76,15.18,14.2,17.07, 15.4,15.94,14.33,15.11,13.81,15.58,15.85,15.28,16.4,15.02,15.73,14.75,14.35] |
|||
3 |
=linefit(A1,A2) |
A1 Input matrix X
B1 Input m=3
C1 Input n=25
D1 Input  =0.05
=0.05
A2 Input Y
A3 The least squares fit the equations, returns an estimate of the regression coefficients

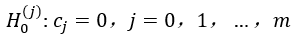
(2) Use F test to check whether there is a linear relationship between the dependent variable y and the independent variables x1, x2, x3. The null hypothesis is ,j=1,2,3. At significance level , if
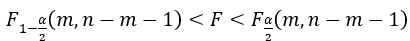 , then accept H0, otherwise refuse.
A |
B |
D |
|
… |
… |
||
4 |
=mul(A1,A3).conj() |
||
5 |
=(A2--A4).sum(~*~) |
||
6 |
=A2.avg() |
||
7 |
=A4.sum((~-A6)*(~-A6)) |
||
8 |
=(A7/B1)/(A5/(C1-B1-1)) |
||
9 |
=finv((D1/2),B1,(C1-B1-1)) |
||
10 |
=finv((1-D1/2),B1,(C1-B1-1)) |
||
11 |
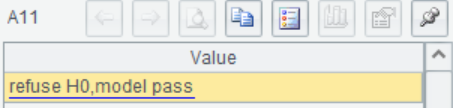
=if(A8>A9&&A8<A10,"accept H0,model do not pass","refuse H0,model pass") |
A4 Multiply X with the regression coefficient, get the predicted value
A5 Calculate SSE
A6 Calculate
A7 Calculate SSR
A8 F=37.753. Calculate F, F=37.753

A9 The upper 1- quantile is calculated using the F inverse cumulative distribution function finv()

A10 The upper quantile is calculated using the F inverse cumulative distribution function finv()

A11 Compare F, 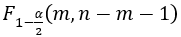 and
and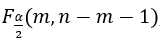 ,return the result.
(3) When H0 is refused,  is not all 0, but it is not excluded that some of them are equal to 0, so a further m+1 t test should be done
For a given, if 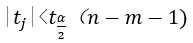 accept
 , otherwise refuse.
A |
B |
C |
D |
|
… |
… |
|||
=inverse(mul(transpose(A1),A1)) |
||||
13 |
=A3.conj().(~/sqrt(A12(#)(#))/sqrt(A5/(C1-B1-1))) |
|||
14 |
=tinv((1-D1/2),(C1-B1-1)) |
|||
15 |
=A13.(if(abs(~)<A14,"accept c"/(#-1)/"=0","refuse c"/(#-1)/"=0")) |
A12 Calculate
A13 Calculate ![]() , from top to bottom as
, from top to bottom as 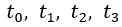
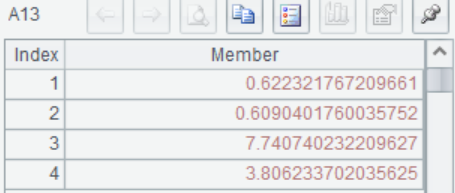
A14 The upperquantile of the T-distribution is calculated using the T-inverse cumulative distribution function tinv()
A15 Compare  and
and 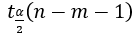 , return the result.
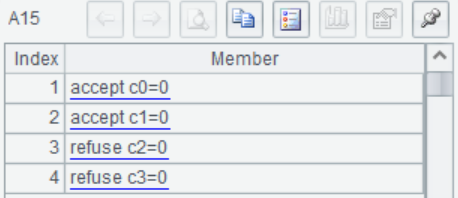
It can be seen from the results that the influence of variable x1 on the model is not significant, so it is not necessary to use x1 when establishing a linear model
SPL Official Website 👉 http://www.scudata.com
SPL Feedback and Help 👉 https://www.reddit.com/r/esProc
SPL Learning Material 👉 http://c.scudata.com
SPL Source Code and Package 👉 https://github.com/SPLWare/esProc
Discord 👉 https://discord.gg/ydhVnFH9
Youtube 👉 https://www.youtube.com/@esProc_SPL

