

Data size and fields
Whether it is data analysis or data mining, the first thing is to browse the data and check the basic information of the data.
SPL provides an interactive interface, which is very friendly to data analysis users.
A |
|
1 |
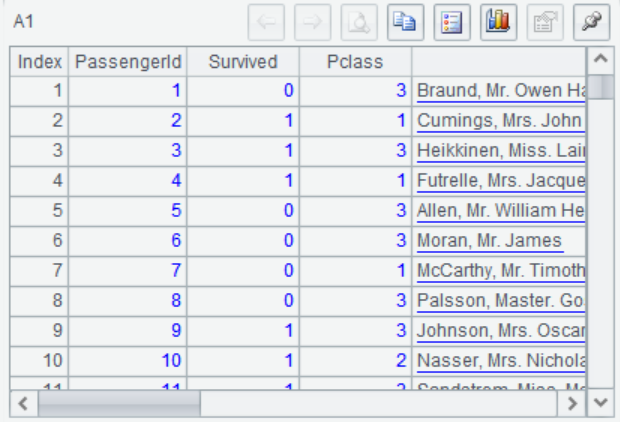
=file("D://titanic.csv").import@qtc() |
2 |
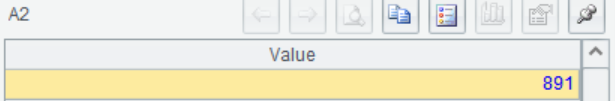
=A1.len() |
3 |
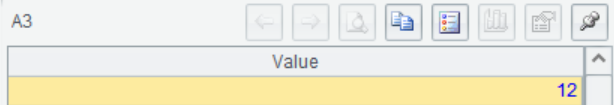
=A1.fno() |
4 |
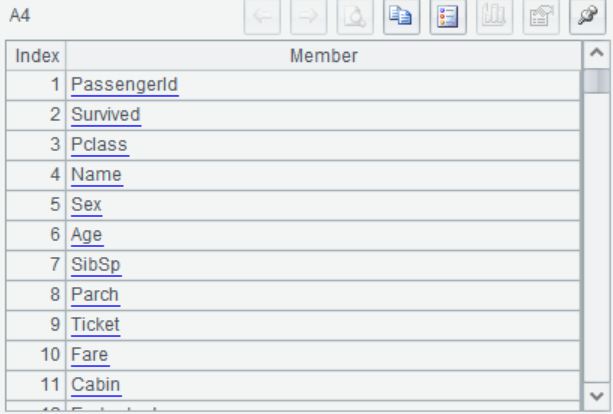
=A1.fname() |
For example, use SPL to view the Titanic data:
A1 Import the data, the running result will display on the right of the SPL page. You can browse the data directly.
A2 View the sample size
A3 Check how many fields there are
A4 Field names
Through the above operations, we know that the Titanic data has 891 rows and 12 columns, and the data includes passengers' personal information and ticket information.
SPL Official Website 👉 http://www.scudata.com
SPL Feedback and Help 👉 https://www.reddit.com/r/esProc
SPL Learning Material 👉 http://c.scudata.com
SPL Source Code and Package 👉 https://github.com/SPLWare/esProc
Discord 👉 https://discord.gg/ydhVnFH9
Youtube 👉 https://www.youtube.com/@esProc_SPL

