

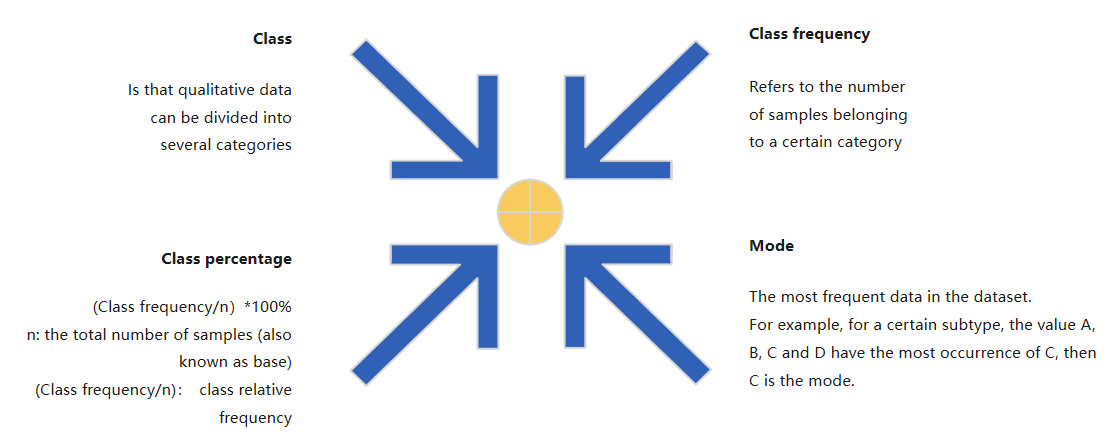
Categorical data
Categorical data is qualitative data, which can be explored and analyzed from the following dimensions.
In SPL, functions such as A.id(), A.group(),A.groups() can be used to perform related operations.
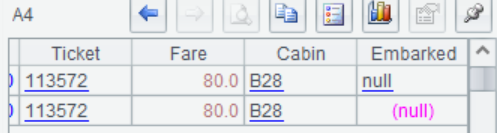
For example, in the Titanic data, there is a variable “Embarked” which means the embarkation information of passengers. And it is a categorical variable. Analyse in SPL:
A |
|
1 |
=file("D://titanic.csv").import@qtc() |
2 |
=A1.id(Embarked) |
3 |
=A1.(Embarked).mode() |
4 |
=A1.group(Embarked) |
5 |
=A1.groups(Embarked;count(~):count,count(~)/A1.len():freq) |
6 |
=A4.run(if(Embarked,Embarked,"null"):Embarked) |
7 |
=canvas() |
8 |
=A6.plot("EnumAxis","name":"x","location":3,"polarX":0.55, "allowLabels":false) |
9 |
=A6.plot("NumericAxis","name":"y","location":4,"allowLabels":false) |
10 |
=A6.plot("Sector","text":A4.(count),"axis1":"x","data1":A4.(Embarked),"axis2":"y","data2":A4.(count)) |
11 |
=A6.draw@p(600,450) |
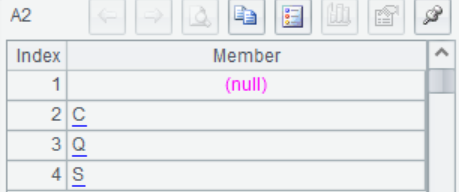
A2 A.id () can be used to check the categories of the variable. As shown in the figure, passengers have three boarding ports: C, Q and S, and also there are some passengers with missing boarding information.
A3 Calculate the mode and get the Embarked mode is "S"
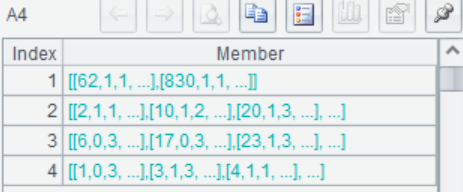
A4 A.group() can be used to group sample data. As shown in the figure, the samples are divided into 4 groups according to different boarding ports of passengers. The first group is the sample of Embarked passengers with missing information.
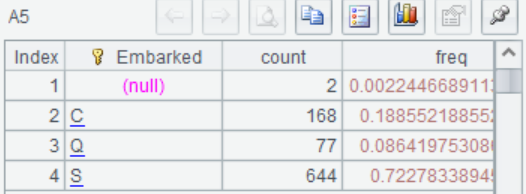
A5 A.groups() can perform group aggregation calculations. As shown it can calculates the number and proportion of each category. For example, there are 168 passengers whose boarding port is "C", accounting for about 18.85%.
A.groups() also support sum/max/min/top/avg/iterate/icount/median
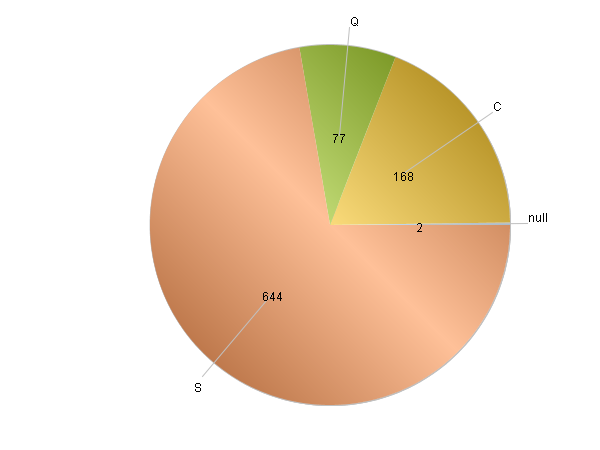
Categorical variables can also be visually viewed.
A7-A11 Draw a pie chart of Embarked.
SPL Official Website 👉 http://www.scudata.com
SPL Feedback and Help 👉 https://www.reddit.com/r/esProc
SPL Learning Material 👉 http://c.scudata.com
SPL Source Code and Package 👉 https://github.com/SPLWare/esProc
Discord 👉 https://discord.gg/ydhVnFH9
Youtube 👉 https://www.youtube.com/@esProc_SPL

