

Correlation between variables
Pearson and spearman can be used to evaluate the relationship between variables in SPL
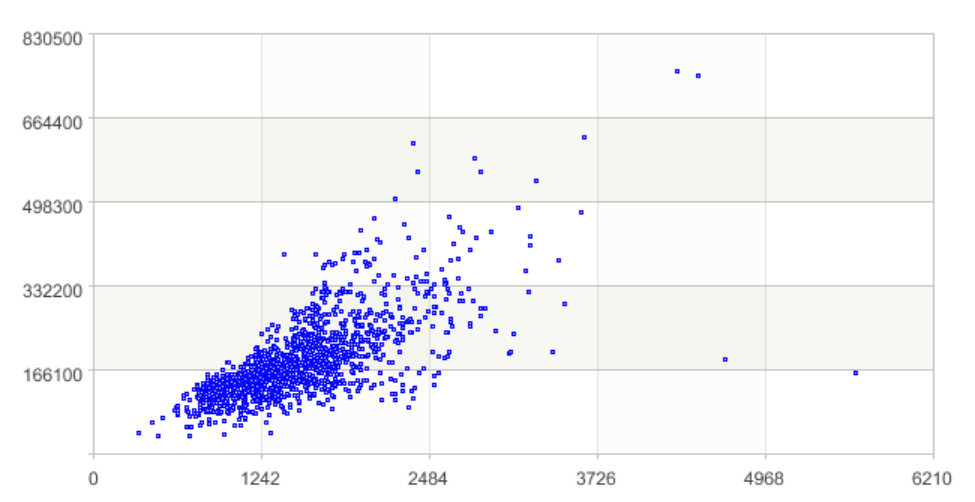
For example, in the data of the housing price forecast, the relationship between the living area GrLivArea and the sales price SalePrice of the house is analyzed.
A |
|
1 |
=file("D://house_prices_train.csv").import@qtc() |
2 |
=A1.(GrLivArea) |
3 |
=A1.(SalePrice) |
4 |
=pearson(A2,A3) |
5 |
=spearman(A2,A3) |
6 |
=canvas() |
7 |
=A6.plot("NumericAxis","name":"x") |
8 |
=A6.plot("NumericAxis","name":"y","location":2) |
9 |
=A6.plot("Dot","lineWeight":0,"lineColor":-16776961,"markerWeight":1,"axis1":"x","data1":A2,"axis2":"y","data2": A3) |
10 |
=A6.draw(800,400) |
A4 Calculate the pearson correlation coefficient between living area and sales price.

A5 Calculate the spearman correlation coefficient

Also, the relationship between variables can be analyzed in a visual way.
A6-A10 Drawing the scatter plot between the two variables, we can see that with the increase of living area, the sale price also shows a linear increase trend.
SPL Official Website 👉 http://www.scudata.com
SPL Feedback and Help 👉 https://www.reddit.com/r/esProc
SPL Learning Material 👉 http://c.scudata.com
SPL Source Code and Package 👉 https://github.com/SPLWare/esProc
Discord 👉 https://discord.gg/ydhVnFH9
Youtube 👉 https://www.youtube.com/@esProc_SPL

