

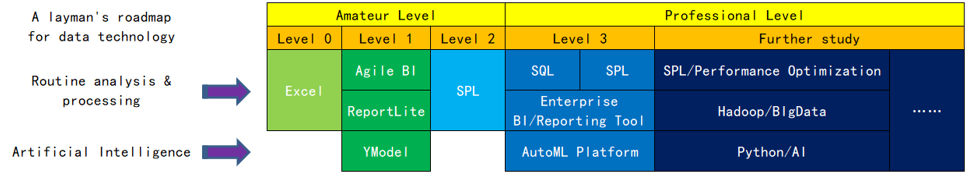
A laymen’s roadmap for data analysis and processing technology
In the era of big data and artificial intelligence, data analysis is a hot topic, and data analysts seem to be a popular profession. Many laymen want to learn, but in the face of the vast and complex technology, they cannot figure out where to start. So, people often ask this question, and of course, more specifically, how can I learn SQL and whether to learn Python? In fact, it is often the same thing behind the scenes.
Intentionally putting “processing” here as well, because data analysis does not exist separately, and the data used for analysis often needs to be prepared and organized by oneself, all of which fall within the scope of data processing. For example, merging a bunch of Excel, maybe the aim of the next step is to analyze them, but this step is indispensable. There are also some things, such as using a roster to generate employee cards, which are obviously not appropriate to be called data analysis, but they are also tasks that need to be done in daily work. This post talks about data processing and analysis all together.
In addition, this is a topic for laymen, and there is no need to talk anymore when it comes to entering a professional level. After that, the related technologies will become more complex, but buddies who can reach that level would already have a clear understanding of their own knowledge, so there is no need to read the nagging of this post anymore.
It should be emphasized that data analysis is not just a technical issue, and it can even be said that the main issue is not technology. Many friends may think that they can do data analysis after mastering some relevant skills, this is not true actually. The key to doing well in data analysis lies in business knowledge, which means you need to know what needs to be analyzed. People with sufficient business experience often use primitive technology to analyze more meaningful results than those without a sense of business using high-end technology. It’s like mastering the driving skills of various vehicles is just a certain skill, and knowing where to sell the goods at a good price is more important. Using a handcart to transport goods, as long as it is transported to the right place, it is possible to earn more money than using a car to transport goods. Don’t be superstitious about technology and tools when doing data analysis. If you don’t already know the business purpose of doing data analysis, learning technology and tools is also useless. Moreover, technologies and tools of the same class and level are usually similar, and there is little difference for the objective of data analysis (Mercedes Benz and BMW are not different for personal riding), making deliberate choices meaningless.
To put it bluntly, this article mainly focuses on technology, as mastering technology can significantly improve work efficiency.
Let’s start with the basics:
Level 0, Excel
You’re not mistaken. Excel is the most basic data analysis and processing technology that everyone can use, so this level is called level 0 and is not numbered.
What Excel can do and how to do it, I won’t say much about it here, there are too many online materials. Moreover, buddies who consider themselves as laymen and care about data technology can always use Excel to some extent. For most people, this level can be considered passable, but it cannot be omitted. If you feel unfamiliar with Excel (such as not being able to use VLookup or write if), then go make up for it yourself. Anyway, this is the foundation of the foundation, and now even the most impressive data analysts cannot get around it.
Level 1, Agile BI
The analysis that Agile BI can help us do is called multidimensional analysis, which involves reviewing statistical data in various classification methods, such as reviewing sales by month, production by region, or reviewing at several angles together. If an area has a large total amount, you can delve into it and see what’s going on. For example, if New York has good sales, you can see whether the people of Queens have a particularly high purchasing enthusiasm. It is also possible to draw various graphs of these statistical data, which can be linked to make it more vivid and easier to identify problems or patterns. This is proper data analysis. Make a report to the boss based on the analysis results, it’s a sure thing to get a promotion or salary increase.
The representative products of Agile BI are mainly PowerBI, Tableau, and other desktop level tools; In fact, Excel itself has a pivot table that can perform basic multidimensional analysis, but the details are not well done enough, and its functionality can also be considered as a level 1 technology.
Level 1, ReportLite
As mentioned earlier, we may also encounter the hassle of using a roster to generate employee cards. Agile BI cannot help with this, but ReportLite is good at it.
Excel has no problem in making reports, but it can only make static reports. Reports with rows and columns changing according to the amount of data, can you make them with Excel? If there are multiple slices and multiple layers of grouping that intersect, and the data changes, it will be very tiring to redo every month, and even a slight mistake will produce the wrong report. Do you think this kind of reporting is considered data analysis? This doesn’t matter, as it is always necessary to do it in daily work, and agile BI products cannot manage to do it.
For ReportLite, these things are very easy. After creating a template, you only need one click when the data changes, and there is no pressure for dynamic row, column, and multi-layer reports.
Why only mention ReportLite instead of other reporting tools?
Because only ReportLite provides usage methods and related course materials for non-professional workplace staff, there are indeed many report tools that can also produce reports, but they are all enterprise level report tools for professional and technical personnel, which buddies at your level cannot handle yet (you can at a later level).
The data analysis and processing represented by agile BI and ReportLite are conventional techniques, and the computational difficulty involved is equivalent to the four arithmetic operations (most of which are addition, and also getting maximum/minimum, etc.), not exceeding the junior high school level, which is easy to understand for any individual. However, these calculations may also involve various conditions, such as adding orders of only 500 dollars or more, and only reviewing the situation in New York in March, which is not difficult but very annoying. Legend has it that the BI analysis on the high end is actually just a few things, and there is no distinction on the details with how we usually use Excel to create reports, only the level of automation is higher, and this thing is not magical after seeing through.
Level 1, YModel
There is another path of data analysis technology, which is currently very popular artificial intelligence (data mining, machine learning, …). The operations involved here are much more complex (but it also relies on conventional data processing techniques to prepare data), and formulas such as probability theory and statistics are often used. This is not simple, far beyond the level of high school, and even college students who have not studied mathematics well cannot understand.
Normally, such complex technology should not be a level 1 thing.
However, with YModel, it’s done.
YModel encapsulates these complex artificial intelligence algorithms. Users only need to prepare the data (which is an Excel spreadsheet) and throw it in, and it can automatically build the model and then make predictions. Because it has solidified decades of experience from top statistical experts, it performs better in most business scenarios than programmers unfamiliar with machine learning algorithms.
Why do we bring up YModel specifically? Are there no other automated artificial intelligence products available?
There are, but they are too heavy, and you still can’t handle them. They are not suitable for players at this level.
The threshold for these three technologies (products) is relatively low, which means writing some formulas, which is only slightly harder than Excel and can be ranked as the first level.
YModel is actually the simplest to use (rarely filling in a formula), but it requires some knowledge of data mining (algorithms don’t need to be understood, it is necessary to have some concepts about the modeling and prediction mechanism, and also to learn how to evaluate the quality of the model). Moreover, artificial intelligence business also appears more high-end, and it can be considered as a level 1.5.
The first level state does not require learning to program (if writing formulas is not considered programming).
Level 2, SPL
Then, it’s time to start learning programming.
Some tasks may involve more complex calculations. Although each step is still the difficulty of the four arithmetic operations, it is difficult to write down with one formula if there are too many steps, and there may be judgments during the process; What’s even more troublesome is that some tasks need to be repeated N times. If they are all done manually, it can be exhausting, such as merging 500 Excel files or splitting one Excel file into 500 small files. Here is a book esProc Desktop and Excel Processing . Most of the cases inside are actually occurring, but it is difficult to implement using Excel or Level 1 technology.
If you have learned programming, these things won’t be a headache.
This principle is easy to understand, but why is it SPL? Aren’t there many programming languages?
There are many, but there is nothing else at this level.
Doing data analysis and processing is mostly about processing data in table form, and it has a professional name called structured data. If the programming language you are learning is not good at dealing with structured data, you can only use it to play with arithmetic puzzles, but it is of no use for data analysis and processing. However, there are not many programming languages that can easily handle structured data, including VBA that comes with Excel. Only SPL and SQL are available, and Python seems to be able to handle it (as claimed by many training classes). However, SQL and Pyhton are both professional level technologies (as will be mentioned later), which are too early to appear in Level 2.
For amateurs learning programming, you can also refer to: A correct method for complete novice to self-study of programming
The above is at the amateur level. Afterwards, you can enter the professional level, which is the world of programmers.
Level 3, SQL
SQL is the first to bear the brunt of data analysis and processing technology in the programmer world. The database may be the place where the most data is stored, and the data here is mainly manipulated using SQL. You are difficult to mix in the data circle without SQL.
Simple SQL looks like English, and syntax is easy to learn. If you have already mastered the concepts and operations of structured data, it is estimated that you can use a few hours of syntax books to perform queries, which should not be a professional level technique. However, even if you have learned SQL, you have no place to use it. You need a database to run SQL, installing a database, and flipping data into it for queries are all very professional tasks. You are already a semi-professional programmer if you can handle such things.
It can be learned using SPL, which also implements common SQL, allowing users to execute SQL on files. However, if you’ve learned SPL, there is no need to learn SQL when processing and analyzing file data. SPL’s computational processing ability is much stronger than SQL.
Here is a post about how beginners learn SQL: How do beginners learn SQL quickly?
Repeat the last point emphasized in this post: SQL is easy to get started, but mastering it is difficult, and complex SQL is always very complex. Simple SQL statements with three or five lines usually only appear in large numbers in textbooks and training classes. In reality, when it comes to length, we usually use K (thousands of characters) instead of lines as the unit for SQL statements used for data analysis.
It is still more suitable at this level.
Level 3, Enterprise level reporting tools and BI systems
Now it’s time to talk about enterprise level reporting and BI software, which can be seen as enterprise level versions of what level 1 agile BI and ReportLite do.
The construction of enterprise applications also involves reporting and BI functions, and professional tool products will be used. We won’t specifically mention them here, as well-known companies are all good. After mastering these products and technologies, as a programmer, when it comes to enterprise level BI and report analysis business, you will be proficient.
The system developed using these technologies can be used by non-professional business personnel. But we did not mention it in the first level, because using an application system that has already been developed within the enterprise does not require specialized learning of any technology. Just follow the operating manual. If there is something difficult, the enterprise also provides unified training, so there is no need to mention it here.
As a system builder, programmers need to know more than users. When learning these technologies (products), it is also necessary to learn deeper theoretical knowledge in multidimensional analysis and report models.
Level 3, SPL
SPL is here again, and it can also serve as a weapon for programmers to process and calculate structured data.
Don’t programmers already have databases and SQL?
Yes, but there are still many scenarios where databases cannot be used and therefore SQL cannot be used. Programmers also need to process file data. In the case that there are multiple databases, it is not possible to directly run SQL. A database that can run SQL is called a relational database, and there are also a bunch of databases that are not relational database, such as MongoDB, as well as data in strange forms such as JSON and XML. At this point, mastering SPL technology is much more convenient as it does not require a database and can calculate any scenario.
Moreover, SQL is not convenient when dealing with many procedural operations, and enterprise applications often encounter SQL that is several to ten kilobytes long, as we mentioned earlier. In most cases, using SPL is much simpler and development efficiency is much higher. Buddies who have experience in enterprise report development know that reports are never gonna be done, and the development cost is extremely high. Even if the reporting tool has solved the presentation well, this phenomenon still occurs mainly because using SQL or Java to implement data calculation is too difficult and inefficient. With SPL, these things will be much easier.
This level of SPL is more complex than the second level, requiring learning how to connect to databases and various other data sources, as well as knowing how to be called by applications.
Level 3, AutoML platform
Let’s talk about the line of artificial intelligence. As a programmer who has just entered the professional level, it is difficult to create complex artificial intelligence models on their own, so they still need to use these AutoML (Automatic Machine Learning) tools. As mentioned earlier, except for YModel being a lightweight product, other AutoML products provided by the industry are a bit heavy. Although they still do not require much knowledge of artificial intelligence algorithms, they still require some programmer skills to be able to work around (not in data processing, but in application system deployment and debugging), so they are listed at this level.
There are also many products and technologies in this category, and the well-known Google is also working on it. We won’t give specific names here, search online for them if you are interested.
By the way, YModel also has a programmer version, which can be considered as a type of AutoML listed at this level.
Similarly, it can also be considered as level 3.5.
And then what? Then we enter the further study period at the professional level, and there are many more technologies.
Conduct performance optimization, use SPL, but focus on high-performance algorithms; Play big data, use Hadoop/Spark/…; To do artificial intelligence, learn Python, actually it is more important to learn mathematics; … If you are at this level, there’s no need to say more.
There seems to be a problem, is Python’s rank so high? Aren’t many training classes claiming that it is something that helps workplace staff improve work efficiency?
That’s right, Python is a very professional thing, and the vast majority of people who use Python are heavy professional players. It just looks simple and can be used to learn basic programming logic without any problems. However, if you want to learn it and use it to process structured data, it is not simple at all. It is not like some training courses claim that ordinary staffs can use it to handle daily work after learning it. This topic has been discussed in the previous link’s post on zero basic personnel learning programming. If you are interested, you can find it for reference.
Python has a large number of open source libraries related to artificial intelligence technology. The automatic machine learning products mentioned earlier are simple to use and sufficient for many scenarios. However, top experts still hope to have deeper control, and there are also many scenarios that automatic machine learning software cannot solve, which requires hands-on efforts. However, this requires a true understanding of artificial intelligence technology, and the core of these technologies is mathematics (statistics).
In addition to Python, similar product technologies include commercial SAS, open-source R, and many algorithms in MATLAB, all can be represented by Python.
Finally, attach a roadmap:
SPL Official Website 👉 http://www.scudata.com
SPL Feedback and Help 👉 https://www.reddit.com/r/esProc_Desktop/
SPL Learning Material 👉 http://c.scudata.com
Discord 👉 https://discord.gg/ydhVnFH9
Youtube 👉 https://www.youtube.com/@esProcDesktop
Linkedin Group 👉 https://www.linkedin.com/groups/14419406/


Chinese version