

High skewness data processing
Manual skewness processing
Skewness handling is to make the distribution of variables present or approximate normal distribution through various mathematical transformations, and the fitting of the model often has obvious improvement.
Commonly used mathematical transformations include: logarithmic transformation, power transformation (such as square root, square, etc.), reciprocal transformation, exponential transformation, rank transformation etc
For example, there is a variable “SalePrice” in the house price data, and perform logarithmic transformation, power transformation and rank transformation on it
A |
|
1 |
=file("D://house_prices_train.csv").import@qtc() |
2 |
=A1.derive(ln(SalePrice):ln_SalePrice,power(SalePrice,1.7):power_SalePrice) |
3 |
=A1.ranks@s(SalePrice) |
4 |
=A2.derive(A3(#):rank_SalePrice) |
5 |
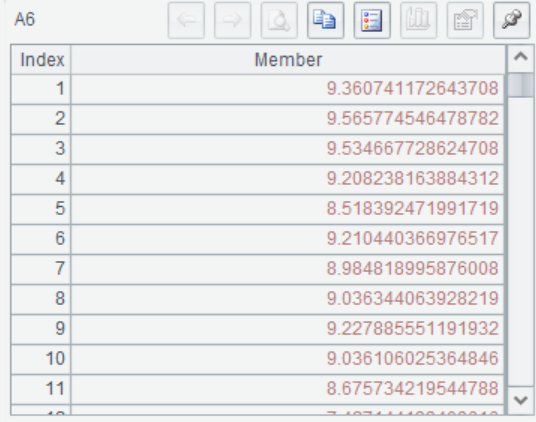
=A4.(SalePrice).skew() |
6 |
=A4.(ln_SalePrice).skew() |
7 |
=A4.(power_SalePrice).skew() |
8 |
=A4.(rank_SalePrice).skew() |
A2 Logarithmic transformation and power transformation
A3 Rank transformation
A5-A8 The skewness values before and after each transformation are returned. Logarithmic correction is better for SalePrice.
Automatic skewness processing
Manual skewness processing is flexible, but it is more troublesome to use, many attempts needed to achieve good results, SPL provides automatic skewness processing functions.
A.corskew()and P.corskew(cn) are used to correct the skewness of numerical independent variable
A.tarcorskew()and P.tarcorskew(tn) are used to correct the skewness of numerical target variable
In the data of housing price prediction, the skewness of both the independent variable "LotArea" and the target variable "SalePrice" are relatively large. The automatic skewness function is used to correct the skewness:
A |
|
1 |
=T("D://house_prices_train.csv") |
2 |
=T("D:// house_prices_test.csv") |
3 |
=A1.(LotArea).skew() |
4 |
=A1.corskew("LotArea") |
5 |
=A4(1).skew() |
6 |
=A2.corskew@r("LotArea",A4(2)) |
7 |
=A1.tarcorskew@c("SalePrice") |
8 |
=A1.tarcorskew@r("SalePrice",A7(2)) |
A1 Import the train data
A2 Import the prediction data
A3 Calculate the skewness of "LotAeea"

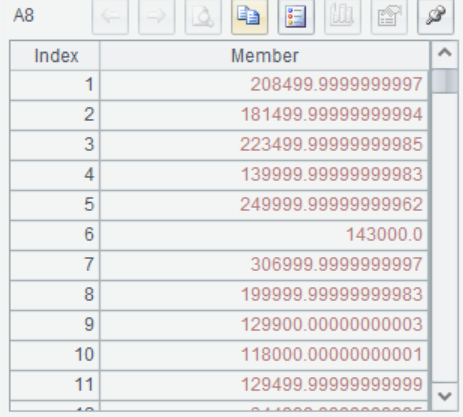
A4 Rec. Skewness processing for “LotAeea”, return the result and processing record Rec.

A5 Calculate the skewness after correction, and the skewness decreases to close to 0 after correction.

A6 According to the Rec of A4, the same variable is corrected on the predicted data set, and the correction result is returned
A7 The target variable is corrected, and the correction result and correction record Rec are returned. @c indicates that the original data is changed to the result after correction
A8 According to Rec of A7, the corrected result is recovered, which is usually used to recover the prediction result
SPL Official Website 👉 http://www.scudata.com
SPL Feedback and Help 👉 https://www.reddit.com/r/esProc
SPL Learning Material 👉 http://c.scudata.com
SPL Source Code and Package 👉 https://github.com/SPLWare/esProc
Discord 👉 https://discord.gg/ydhVnFH9
Youtube 👉 https://www.youtube.com/@esProc_SPL

