

Partial least squares fitting
Partial least squares regression provides a many-to-many linear regression modeling method, especially when the number of variables of the two groups is large, there are multiple correlations, and the sample size is small, the model established by partial least squares regression has many advantages that traditional classical regression analysis methods do not have.
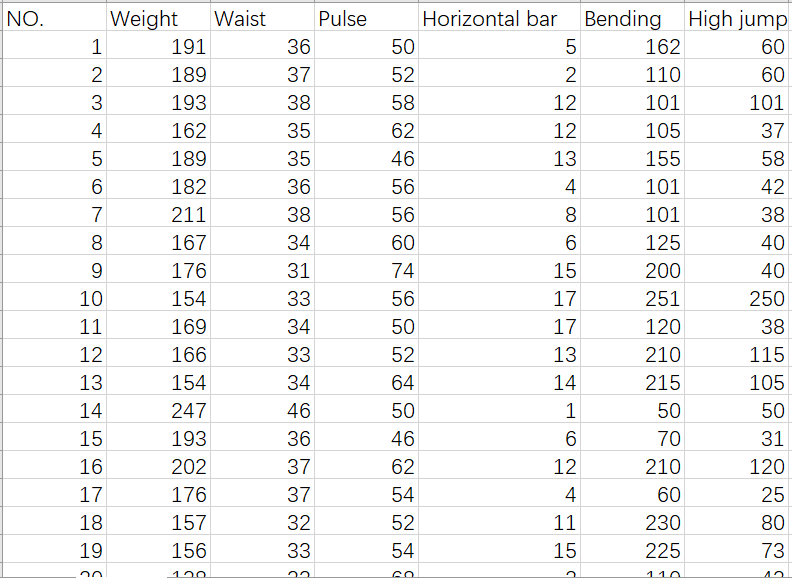
For example, the following figure shows the data on physical training, and the measured variables are divided into two groups. The first group is physical characteristics index X, including weight (x1), waist circumference (x2), pulse rate (x3). The second group is the training result index Y, including horizontal bar (y1), bending (y2) and high jump (y3). The regression model between Y and X is established by partial least square method.
A |
|
1 |
=file("plsdata.xlsx").xlsimport@w() |
2 |
=transpose(A1.to(2:)).to(2:) |
3 |
=transpose(A2.to(:3)) |
4 |
=transpose(A2.to(4:)) |
5 |
=pls(A3,A4,3) |
6 |
=transpose(pls(A3,A5)) |
7 |
=canvas() |
8 |
=A7.plot("NumericAxis","name":"y_pre","title":"prediction data") |
9 |
=A7.plot("NumericAxis","name":"y","location":2,"title":"observation data ","titleAngle":270) |
10 |
=A7.plot("Dot","lineWeight":0,"lineColor":-16776961,"markerWeight":1,"axis1":"y_pre","data1":A6(1),"axis2":"y","data2": A2(4)) |
11 |
=to(20) |
12 |
=A7.plot("Line","markerStyle":0,"axis1":"y_pre","data1":A11,"axis2":"y", "data2":A11) |
13 |
=A7.plot("Legend","legendText":"Horizontalbarprediction","iconWidth":0) |
14 |
=A7.draw(600,600) |
A1 Import the data as a secondary sequence
A2 Remove the serial number and title, keep the data matrix
A3 The independent variables X
A4 The dependent variables Y
A5 Partial least square method is used to fit the model, and the coefficient of fitting model is returned
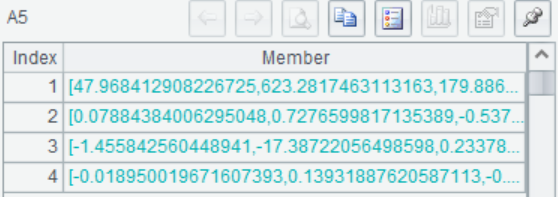
For example, the first column indicates:
y1=47.9684+0.0788x1-1.4558x2-0.0190x3
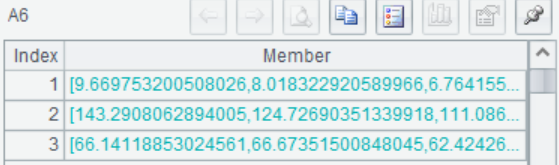
A6 Pass in the prediction data, and the model built by A5, make predictions, and return the predicted results. The values of y1, y2, and y3
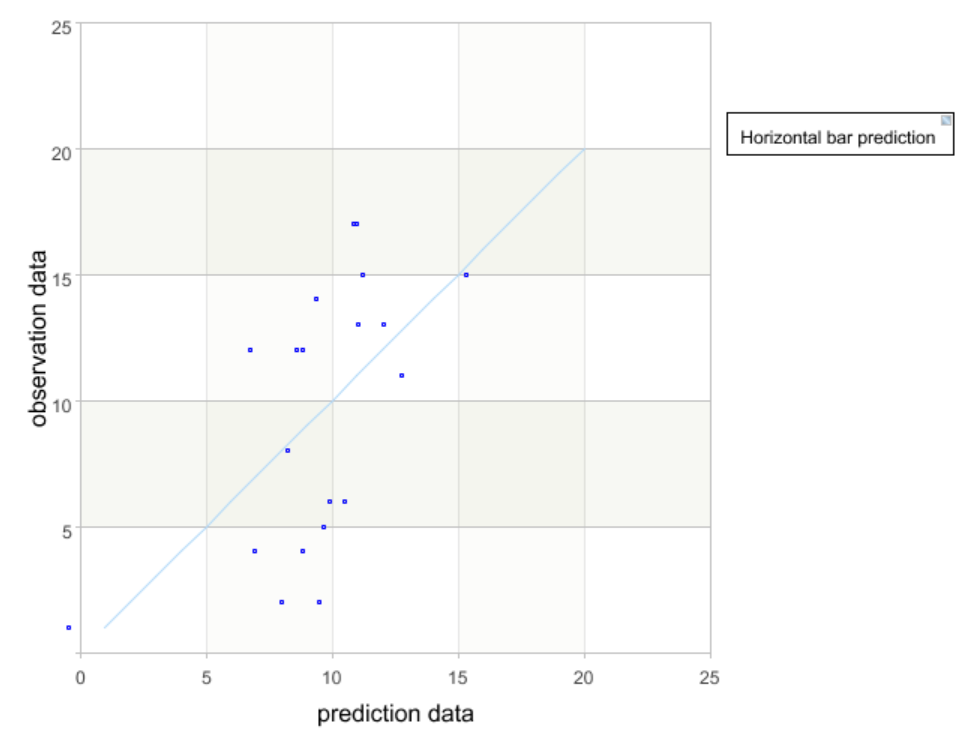
A7-A14 Take horizontal bar y1 as an example to draw a picture and evaluate the model performance. The horizontal axis represents the predicted value of the horizontal bar data for each sample, and the vertical axis represents the true value of the observed data. If all the points can be evenly distributed near the diagonal, then the fitting value of the equation has little difference from the original value, and the fitting performance of the equation is good. In the same way, the prediction performance of y2 and y3 can be drawn.
A7 Generate canvas
A8 Plot the horizontal axis, the prediction value
A9 Draw the vertical axis, the true value of the observation data
A10 Plot point primitives with the horizontal axis is the predicted value of the horizontal bar and the vertical axis is the true value of the horizontal bar
A11 Take a fixed interval of [1,20]
A12 Draw a line, y=x
A13 Draw the legend
A14 Perform the drawing
SPL Official Website 👉 http://www.scudata.com
SPL Feedback and Help 👉 https://www.reddit.com/r/esProc
SPL Learning Material 👉 http://c.scudata.com
SPL Source Code and Package 👉 https://github.com/SPLWare/esProc
Discord 👉 https://discord.gg/ydhVnFH9
Youtube 👉 https://www.youtube.com/@esProc_SPL

