

Actually, you will never be able to master Python
Title party, there are thousands of Python programmers, of course, many people can master it. The term “you” here refers to none professionals in the workplace.
People in the workplace usually use Excel to process data, but there are also many helpless situations, such as complex calculations, duplicate calculations, automatic processing, etc. When encountering a crash without saving, it can often cause people to collapse. If you can master a programming language, these problems won’t be a problem anymore. So, what should we learn?
Countless training institutions and online materials will tell us: Python!
The Python code looks very simple, it can solve many troublesome Excel problems in just a few lines, and it looks really good.
But is that really the case? As none professionals, can we really use Python to assist us in our work?
Hehe, it just looks beautiful!
In fact, Python is not suitable for people in the workplace because it is too difficult. As a none professional in the workplace, you just cannot master it, and even the difficulty of Python may be so great that you cannot understand why it is too difficult to learn.
The data encountered in daily work is mostly in the form of Excel spreadsheets, known as structured data. To assist daily work, programming languages need to have strong structured data processing capabilities.
Python requires an open-source package called Pandas to handle structured data, which is not an inherent component of Python. You have to download and install it yourself, and the process is not very simple. It needs to be accompanied by a bunch of things that make beginners dizzy. Of course, third-party programs can also be used, but the installation of these third-party programs themselves is a problem, and there are a lot of engineering environment configurations when starting up that make people feel confused (they are designed for large applications). And also debugging, you can’t write the code right all at once. The debugging function of the Python development environment is not very good, and Pandas is not native to Python, making debugging even more difficult.
These troubles are still off topic and can be overcome. The key issue is that Pandas is not designed for structured data, and there are many things that cannot be as desired and are very difficult to understand
Let’s take a look at an example, such as this table:

Each row of data, except for the first row, is called a record, corresponding to an event, a person, an order… The first row is the title, indicating which attributes make up the record. These records all have the same attributes, and the entire table is a set of these records.
In Pandas, an object called DataFrame is mainly used to process this type of table data. After reading the table into DataFrame, it looks like this:
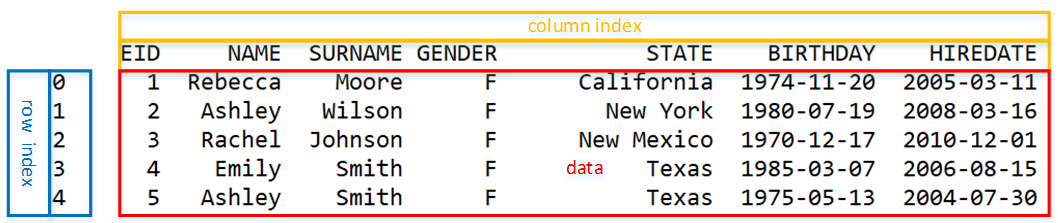
It looks similar to Excel, except the row numbers start from 0.
First, try summarizing the number of people in each department:
import pandas as pd
data = pd.read_csv('Employee.csv')
group = data.groupby("DEPT")
dept_num = group.count()
print(dept_num)
Grouping and then counting is a common approach, but the result is a bit awkward:
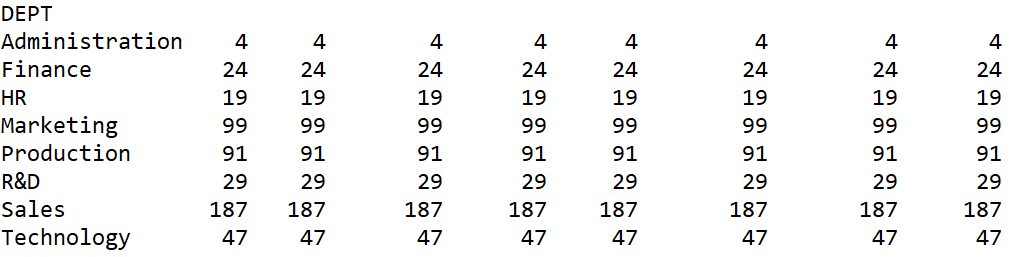
The number of department members, which is the number of members in each group, only needs one column. Why are there so many columns? It seems like it has done the same action for each column, which is strange.
This is because DataFrame is essentially a matrix, not a set of records, and Python does not have such a concept of record. When count is applied to a matrix, it counts each column, which is somewhat unexpected.
Simple filtering operations, such as extracting employees in the R&D department, may result in a subset of the personnel table, but in reality, it is the entire personnel table (matrix) and some selected row positions (called row indexes), which can be understood as submatrix. At this point, the output results may not show anything, but if you want to further operate, such as giving a 5% salary increase to R&D department employees, you will once again find it “unexpected”.
When using DataFrame to process structured data, it is necessary to follow the matrix approach, which can be very challenging for beginners to understand.
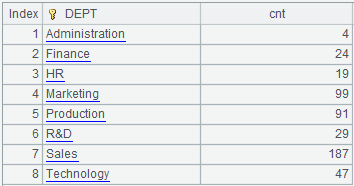
How can we correctly output the number of department members? The size function needs to be used to view the number of members in each group.
import pandas as pd
data = pd.read_csv('Employee.csv')
group = data.groupby("DEPT")
dept_num = group.size()
print(dept_num)
This result is normal:

However, this result is no longer a two-dimensional DataFrame, but a one-dimensional Series, and it can no longer continue to apply the methods of DataFrame, which is another “unexpected”.
Apparently the grouping and aggregation result is also a structured data table with rows and columns, is it not good to continue using DataFrame? Why do we need to create something else? It’s puzzling.
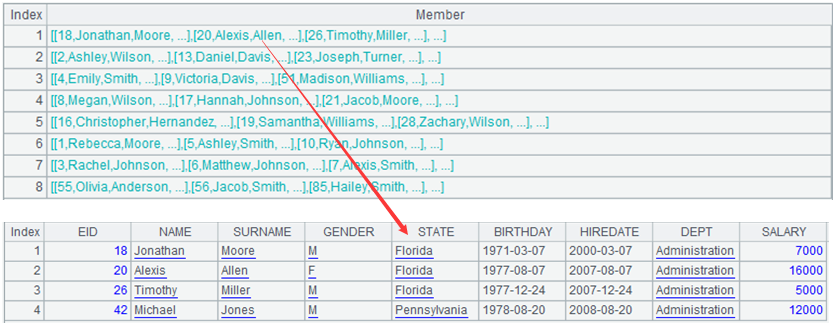
Python does not stop at these two. For example, the essence of grouping operations is to partition a large set into small sets, and the result should be a set of sets. Then let’s take a look at what DataFrame looks like after grouping? Print the grouping results in the above code to observe.
import pandas as pd
data = pd.read_csv('Employee.csv')
group = data.groupby("DEPT")
print(group)
It outputs:
"pandas.core.groupby.generic.DataFrameGroupBy object at 0x000001ADBC9CE0F0"
What is this thing? Is this a set of sets?
Search online, it turns out that this is called an iterable object. Each member of it is composed of DataFrame plus a group index, and there are also methods to split and observe. This object, known as "iterable object", is essentially a set of submatrixes of a large matrix, which can barely be considered a set of sets. However, it cannot directly use a sequence number to get a member like a regular set (such as group [0]).
I guess many people have already fainted at this point, and can’t figure out what nonsense I’m talking about. Well, that’s right, this is the normal state for people in the workplace.
Python has N “objects” to describe the same type of data, each with its own adaptation scenarios and operation rules. For example, DataFrame can be filtered using the query function, while Series cannot, and after grouping, this object becomes completely different. The transition between these things is also very “smooth”, and if you’re not careful, they become something else you don’t know. As a result, programming mostly relies on googling, and even if you run it right, you still can’t understand why and can’t remember it, and you’ll have to google again next time.
Let’s take a step further, to sort the employees of each department by hiredate from early to late. This only needs to group and sort the grouped subsets by hiredate. The following is the code:
import pandas as pd
employee = pd.read_csv("Employee.csv")
employee['HIREDATE']=pd.to_datetime(employee['HIREDATE'])
dept_g = employee.groupby('DEPT',as_index=False)
dept_list = []
for index,group in dept_g:
group = group.sort_values('HIREDATE')
dept_list.append(group)
employee_new = pd.concat(dept_list,ignore_index=True)
print(employee_new)
It looks a bit verbose. You need to write a for loop to do it bit by bit, which doesn’t seem to reflect the advantages of set-oriented data processing. After all, structured data is batch and set type, and writing it is so verbose, so the difference between it and VBA is not significant.
Well, actually Python also has a way of writing without a for loop:
import pandas as pd
employee = pd.read_csv("Employee.csv")
employee['HIREDATE']=pd.to_datetime(employee['HIREDATE'])
employee_new = employee.groupby('DEPT',as_index=False).apply(lambda x:x.sort_values('HIREDATE')).reset_index(drop=True)
print(employee_new)
But, can you understand the second to last statement, which is the most crucial one here, with the “apply” and “lambda”?
This is the concept of “functional language”, and its writing complexity and understanding difficulty are beyond the capabilities of most none professionals. I will not go through the trouble to explain the specific meaning here, and you can search for it yourself to see if you can understand it.
To summarize briefly:
DataFrame is essentially a matrix, not a set of records. Programming requires thinking about it in a matrix like manner, which can often be a bit convoluted and result in “unexpected outcomes”.
Even more troublesome is that Python has too many similar data types, such as Series, DataFrame, and the grouped objects can all represent a certain set, but each has its own rules, and the calculation method is even more elusive. To understand these principles and apply them correctly, the difficulty and complexity are not something that none professionals can and should do.
There are also things like apply+lambda, if you don’t use them, the code for batch data processing is too verbose, but if you use them, they are difficult to understand.
In fact, Python is a highly ranked thing. For none professionals, the power and convenience of Python only exist in training classes. You rarely see people around you using Python to tinker with their Excel. The true users of Python are highly skilled professionals, mainly those who specialize in artificial intelligence.
For none professionals, esProc SPL is much simpler.
SPL has only one type of set, a structured data table is the set of records, and the grouping result is the set of sets. The same set of operations can be performed on these sets.
Looking at the previous example, grouping and aggregation and simple count can get normal result:
| A | |
|---|---|
| 1 | =file("Employee.csv").import@tc() |
| 2 | =A1.groups(DEPT;count(~):cnt) |
The result of grouping is the set of sets, which is easy to understand:
| A | |
|---|---|
| 1 | =file("Employee.csv").import@tc() |
| 2 | =A1.group(DEPT) |
To sort grouped subsets does not require complex lambda, but remains concise. SPL has made functional languages unnoticeable.
| A | |
|---|---|
| 1 | =file(“Employee.csv”).import@tc() |
| 2 | =A1.group(DEPT) |
| 3 | =A2.conj(~.sort(HIREDATE)) |
esProc SPL is the programming language that none professionals may truly master and use.
SPL Official Website 👉 http://www.scudata.com
SPL Feedback and Help 👉 https://www.reddit.com/r/esProc_Desktop/
SPL Learning Material 👉 http://c.scudata.com
Discord 👉 https://discord.gg/ydhVnFH9
Youtube 👉 https://www.youtube.com/@esProcDesktop
Linkedin Group 👉 https://www.linkedin.com/groups/14419406/


Chinese version