

ReportLite Practice: zoned cross report involving multi-table association
When conducting data analysis, there will often be some data comparison tasks, which need to associate the data of multiple tables for display. For example, we have two xls tables that contain the sales data and the cash collection data of each state respectively. Here below is the Sales data table:

Cash collection data table:

Now we want to see a comparison table like this:

Should we use Excel to carry out this task, we would need to create a pivot table for each of the two tables, and use VLOOKUP to associate the two tables on States. However, for such multi-column association, it needs to write VLOOKUP many times, which is too cumbersome. Moreover, the category is variable and the number of columns is not fixed, so using VLOOKUP alone cannot get the effect we want.
It is easy to handle this task with ReportLite. By using its report feature, we can easily associate the data of multiple tables, and set the report style flexibly.
Report making
Start ReportLite, create a new report and set the data used in the report: ReportLite tool bar > Report > Dataset > Add > File dateset, then select the xls file to be used.
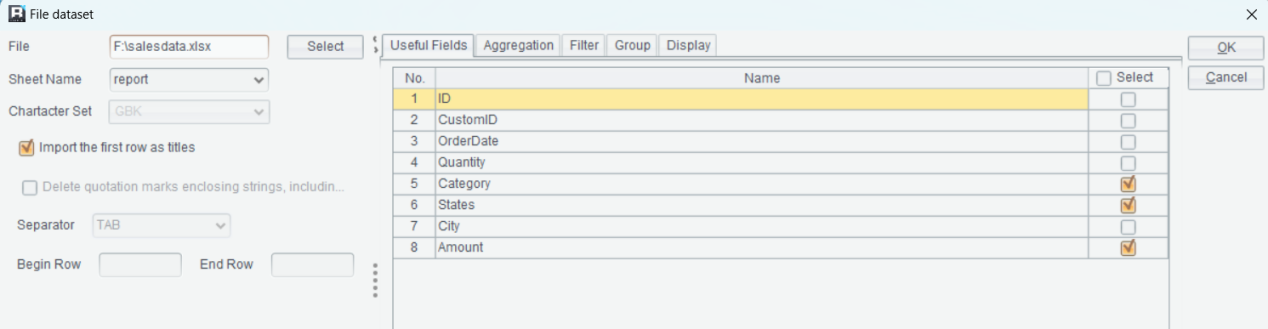

The ds1 in the Name column is automatically generated, representing the name of the xls file read into ReportLite. In the report template, this name is used to set the binding relationship between cell and data.
Since the report requires the data of two xls files, it needs to click “Add” again to select another xls file.


Next, make the report template:

ReportLite adopts an Excel-like design; its cell naming and some common formulas are consistent with Excel.
This report can be seen as the horizontal concatenation of two cross reports. The formula =ds1.group(States;States:1) in A3 means retrieving the data of the States column from ds1 and grouping the data by States, and the calculation of the cell to the right of it will be limited to the corresponding group in ds1. Similarly, B2 uses the group function to set the Expanding Mode property of cell B2 to Horizontal (in the property bar on the right). In this way, a bi-direction stretch effect of A3 vertical stretching and B2 horizontal stretching can be achieved when previewing the report.
The formula =ds1.sum(Amount) in B3 means performing sum operation on Amount of the intersection area.
The method of making column C of the report is similar to that of making column B. The key is the formula ‘=ds2.sum(Collection,States==A3)’ in C3. This formular adds an association condition, which means taking the same Collection data of States and A3 from ds2 and performing sum operation.
As for the format adjustment, it is very easy to handle. Cells merging, header slash setting, cell font color setting, color filling, data format and other settings are the same as those in Excel.
The report can be previewed after the report template is made:
Now the report can be saved as a XLS file.
From the process of making the report template, it can be seen that it only needs to write the formula in one cell when associating the data of multiple tables, which is very convenient. The cell will automatically stretch based on the amount of data, so there is no need to modify the report template even if the data changes. Moreover, the automatic stretch feature of cell enables certain style operations to be set on just a few cells, making the process more convenient.
Download ReportLite and more at http://www.raqsoft.com/reportlite.
SPL Official Website 👉 http://www.scudata.com
SPL Feedback and Help 👉 https://www.reddit.com/r/esProc_Desktop/
SPL Learning Material 👉 http://c.scudata.com
Discord 👉 https://discord.gg/ydhVnFH9
Youtube 👉 https://www.youtube.com/@esProcDesktop
Linkedin Group 👉 https://www.linkedin.com/groups/14419406/


Chinese version