

SPL quantitative practice series: backtesting routine
One essential step in quantitative trading is backtesting. Any strategy needs to be validated with historical data before it can be used for paper trading or even real trading. This article will introduce how to conduct backtesting in SPL.
Without further ado, let’s get straight to the point.
Suppose we have the following trade data generated according to a certain strategy:
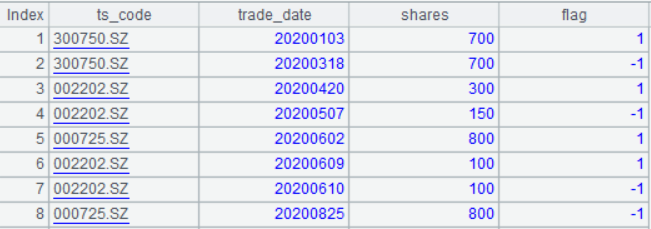
In this table, ‘ts_code’ refers to the stock code; ‘trade_date’ refers to the trade date; ‘shares’ refers to the number of shares traded, and ‘flag’ refers to the trade flag (1 denotes buy, -1 denotes sell).
Now we need to conduct a backtest on the strategy based on the trade data and the following daily market data:
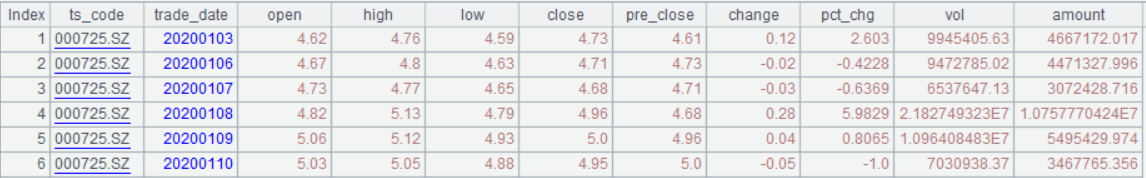
Because some stocks may involve cash dividend, stock dividend, etc., their prices and trading volume need to be adjusted accordingly (such operation is hereinafter referred to as ‘adjustment’). There are two types of adjustments: forward adjusting and backward adjusting. Since this is a backtest task, we use the backward adjusting method. As for the specific steps, it will not be introduced in detail here. If you are interested, refer to the article Adjustment of Stock Price.
Common backtest indicators:
-
Cumulative rate of return: the ratio of return on the last day to the invested capital.
-
Annualized rate of return: (cumulative rate of return + 1)(252/number of trading days)-1, where ‘’ is the power exponent symbol; 252 is an assumed fixed number of trading days in a year; number of trading days is the interval between the start and end time of the strategy.
-
Annual volatility: daily volatility *(square root of 252), where the daily volatility is the standard deviation of daily rate of return, which can be used to measure risk.
-
Sharpe ratio: the ratio of the annualized rate of return minus risk-free rate of return to the annual volatility, which is used to measure the risk-reward ratio of stock portfolio or fund.
-
Maximum drawdown: the ratio of the difference between the highest rate of return and the subsequent lowest rate of return to the highest rate of return plus 1.
-
Invested cash: all cash (including commission) required to complete these transactions.
-
Total assets: cash available after completing these transactions plus stock value.
-
Stock holding ratio: the ratio of the existing stock value to total assets.
-
Profit times, losses times: the profit times and the losses times in these transactions. As long as the income increases after a stock is sold, it is considered profit once. Conversely, if the income decreases, it is considered loss once.
SPL code:
| A | B | |
| 1 | =trade_data | |
| 2 | =end_date | / End date |
| 3 | =daily_dir="daily/" | |
| 4 | =directory(daily_dir) | |
| 5 | =A1.trade_date | / Start date |
| 6 | =A1.id(ts_code) | / Stock code |
| 7 | =A4.align(A6.(filename@n(~)),filename@n(~)) | |
| 8 | =A7.(file(daily_dir/~).import@tc().select(trade_date>=A5&&trade_date<=A2)) | / Daily stock price |
| 9 | =A8.(~.derive(if(#>1, close/ pre_close *factor[-1], close/pre_close):factor)) | / Add the adjustment factor |
| 10 | =A9.((hfq_fst=~(1),~.derive(round(factor/hfq_fst.factor*hfq_fst.close,2): hfq_close))) | / Add the forward and backward adjusting close prices |
| 11 | =A1.group(ts_code) | |
| 12 | =A10.((idx=#,~.join(trade_date,A11(idx):trade_date,shares,flag))) | / Add the number of shares traded and the trade flag |
| 13 | =A12.((num=0,money=0,~.derive(shares*hfq_close:trade_amt,if(!shares&&#==1,0,if(shares,(num=num+shares*flag),num)):share_num,hfq_close*share_num:hold,round(if(flag==1,money=money-hold,if(flag==-1,money=money+hfq_close*shares,money)),2):cash,if(flag==1,max(trade_amt*(0.0003),5)+trade_amt*0.00001,if(flag==-1,max(trade_amt*(0.0003),5)+trade_amt*(0.00001+0.0005),0)):commission,round(hold+cash-commission,2):income))) | / Add the holding amount, cash amount, commission, and income |
| 14 | =A13.conj() | |
| 15 | =A14.group(trade_date;round(~.sum(hold),2):holds,round(~.sum(income),2):income,round(~.sum(commission-cash),2):needs,(f=~.(flag),if(f.pos(1)>0,1,0)):buy,if(f.pos(-1)>0,-1,0):sell) | / Count the holding amount, income and required cash by day |
| 16 | =round(A15.max(needs),2) | / Invested cash |
| 17 | =A15.(income/A16) | / Cumulative daily rate of return |
| 18 | =A17.m(-1) | |
| 19 | =round(A18*100,2)/"%" | / Cumulative rate of return |
| 20 | =power(A18+1,252/A15.len())-1 | |
| 21 | =round(A20*100,2)/"%" | / Annualized rate of return |
| 22 | =pma=A17.pmax(),ma=A17(pma),mi=A17.to(pma,).min(),round((ma-mi)/(ma+1)*100,2)/"%" | / Maximum drawdown |
| 23 | =round(A15.m(-1).income+A16,2) | / Total assets |
| 24 | =lst=A15.m(-1),round(lst.holds/A23*100,2)/"%" | / Stock holding ratio |
| 25 | =A17.(if(#==1,0,~-~[-1])) | / Daily rate of return |
| 26 | =sqrt(var@s(A25)) | / Daily volatility |
| 27 | =A26*sqrt(252) | |
| 28 | =round(A27*100,2)/"%" | / Annual volatility |
| 29 | =round((A20-0.03)/A27,2) | / Sharpe ratio |
| 30 | =A13.(~.group@i(flag[-1]==-1)) | |
| 31 | =A30.(~.select(~.m(-1).flag==-1).align@a([true,false],~.m(-1).income>~.~.income)) | |
| 32 | =A31.sum(~(1).len()) | / Profit times |
| 33 | =A31.sum(~(2).len()) | / Losses times |
| 34 | =[A19,A21,A28,A29,A22,A16,A23,A24,A32,A33] | |
| 35 | Cumulative rate of return, annualized rate of return, annual volatility, sharpe ratio, maximum drawdown, invested cash, total assets, stock holding ratio, profit times, losses times | |
| 36 | =A35.new(~:indicatiors,A34(#):value) |
Explanation on key codes:
A1: The trade_data refers to the trade signal and the number of shares. Because this is backtest method, this data is used as a parameter for the ease of calling by other programs. The trade_data in this example is as follows:
A2: The end_date refers to the end date of transaction. The reason for taking it as a parameter is to facilitate the subsequent retrieval of daily market data.
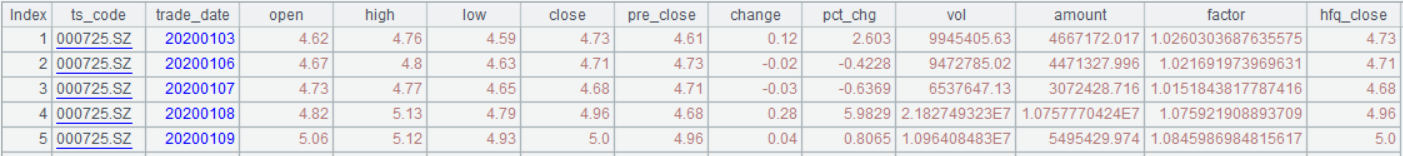
A10: Add the adjustment factor and forward and backward adjusting close prices for each stock. See below for details:
A12: Associate the trading data with market data by trade date. The results are as follows:

When associating by a date when no transaction occurs, the number of shares and trading flag are null.
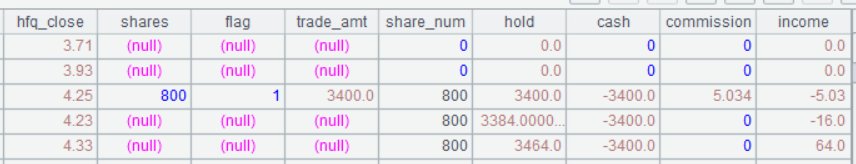
A13: Add the holding amount, cash amount, commission, and income.
In this code, holding amount = number of shares held * backward adjusting close price; number of shares held = existing number of shares + number of shares traded * trade flag.
Cash amount: for buy operation, cash amount = available cash - holding amount; for sell operation, cash amount = available cash + backward adjusting close price * number of shares sold.
Commission:
Commission for buy operation: max (buy amount * 0.03%, 5) + buy amount *0.001%.
Commission for sell operation: max (buy amount * 0.03%, 5) + buy amount *(0.001%+0.05%).
In these two formulas, 0.03% represents the max commission rate charged by the broker; 5 represents the min commission, that is, when the commission is less than 5, it will be charged at USD 5; 0.001% represents the transfer fee; and 0.05% represents the stamp duty (charged only when selling).
Income: holding amount + cash amount – commission.
Note: Since we assume the initial cash amount is 0, the cash amount and income may be negative.
Part of the data is shown below:
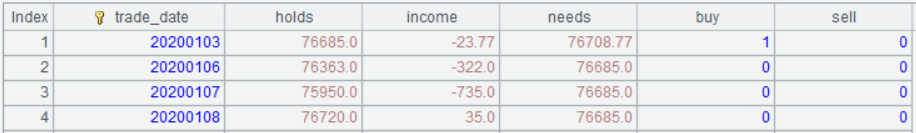
A15: Summarize the holding amount, income, and required cash by day.
Calculate all holding stocks by day. The holding amount and income are both simple summation calculation. The required cash = commission - cash amount (calculating this way is because that the commission is positive, while the cash amount may be negative), and then sum. If there is a buy action on a day, the buy flag (buy) = 1, otherwise buy = 0; if there is a sell action on a day, the sell flag (sell) = -1, otherwise sell = 0. Calculation results:
A16: The max required cash in A15 is exactly the amount of capital that needs to be invested in these transaction processes.
In general, we also want to see a trend chart for rate of return since the transaction. Below we will introduce the data required for this chart.
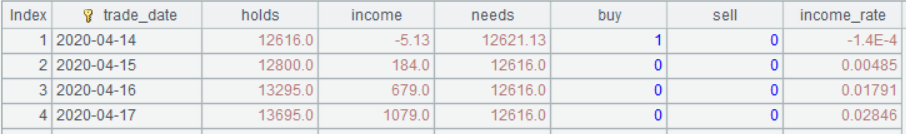
In A15, the daily profit and buy/sell point have been calculated. We just need to divide the daily profit by the invested capital to obtain the daily rate of return, and convert the trade_date to date format.
SPL code:
A15.derive(round(income/A16,5):income_rate).run(trade_date=date(string(trade_date);“yyyyMMdd”))
Calculation results:
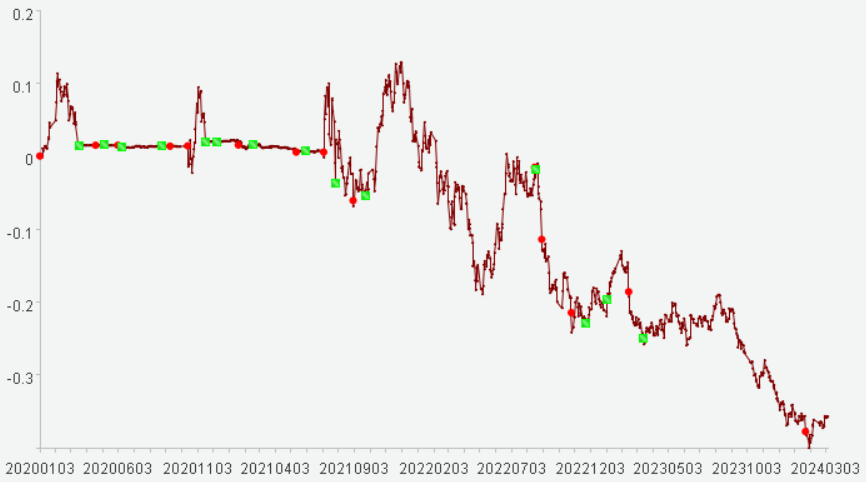
With these data, the trend chart for rate of return can be worked out. To be specific, take trade_date as x-axis and income_rate as y-axis; take the point where buy is 1 as buy point (denoted by a red round dot), and the point where sell is -1 as sell point (denoted by green square dot).
Since the code for plotting the chart is a bit long (as there are too many chart attributes) and it is not the focus of the article, the code is not given here. If you want to learn the knowledge related to plot in SPL, refer to section 12.1-12.4 Graphic Designer in the book SPL Programming.
Trend chart for rate of return:
See the following table for the backtesting indicators:
| indicators | value |
| Cumulative rate of return | -35.81% |
| Annualized rate of return | -10.47% |
| Annual volatility | 18.19% |
| Sharpe ratio | -0.74 |
| Maximum drawdown | 46.88% |
| Invested cash | 372725.4 |
| Total assets | 239237.4 |
| Stock holding ratio | 48.94% |
| Profit times | 4 |
| Losses times | 10 |
SPL Official Website 👉 http://www.scudata.com
SPL Feedback and Help 👉 https://www.reddit.com/r/esProc
SPL Learning Material 👉 http://c.scudata.com
SPL Source Code and Package 👉 https://github.com/SPLWare/esProc
Discord 👉 https://discord.gg/ydhVnFH9
Youtube 👉 https://www.youtube.com/@esProc_SPL


Chinese version