

Detailed discussion on pivot
Abstract
We often encounter the problem of transforming rows and columns of data tables in daily work. SQL provides pivot and unpivot functions of static transposition, but the scope of application is limited. To implement some complex transposition functions with SQL often encounters the problem of too complex statements, and lacks a standard solution. The SPL language of esProc can make up for the deficiency of SQL perfectly because of its flexible syntax and abundant function library.
Next, the implementation of the transpose function is described in detail through some examples.
Basics
Row to column
1. Database pivot
Pivot is not a function that existed from the very beginning. It is only supported by newer versions of major database vendors, such as Oralce 11g or Sql Server 2005.
As you can guess from the name, this function is to transform rows and columns, that is, to use the values in rows as column names. However, the rows and columns of the database, unlike ordinary tables, can not directly be X-axis and Y-axis mutually exchanged and the case is over. The reason for this is that columns in a database are unique (that is, column names cannot be repeated), while rows store dynamic data, which can be repeated if they are not used as primary keys. Therefore, the practical application of pivot basically follows the operation of grouping and aggregation, and each row of data of the column used for transpose (usually dimension) is processed into non-repetitive values by grouping, then the values of each row are expanded as column names.
From the specific application point of view, pivot’s function is actually to subdivide the aggregation results of a column into more specific aggregation results of columns, in order to achieve more intuitive visual effects.
Are concepts boring and hard to understand? Let’s illustrate with a specific example, for example, there is a StudentScore table in Oracle database:

If we want to count the highest scores of each subject in each class, the traditional method is:
select CLASS,SUBJECT, max(SCORE) THE_HIGHEST_SCORE from STUDENTSCORE group by CLASS,SUBJECT
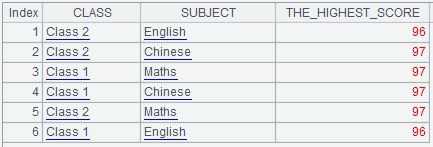
The impression of above results can be said to be very bad: first, in the “class” column, the repetition of Class 1 and Class 2 makes it easy to misread; secondly, in the “subject” column, the three subjects of Chinese, Mathematics and English are all put together, but in fact, the highest scores of the three subjects have no comparative significance.
In fact, we should prefer to see the following results:
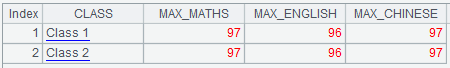
In this result, each of the three subjects in the subject column is separated as a single column respectively, which not only reduces the useless duplication, but also clarifies the mutual independence among the highest scores of each subject, and seems to be much clearer.
It can be said that pivot was born for this purpose. In order to achieve the above results, now the query is written as follows:
select * from (select CLASS, SUBJECT, SCORE from STUDENTSCORE) pivot (max( SCORE) for SUBJECT in ('Maths' as MAX_MATHS, 'English' as MAX_ENGLISH, 'Chinese' as MAX_CHINSES))
2. esProc pivot
Some students may ask, since pivot already exists in the database, why do I need pivot of the esProc?
The answer is: first of all, not all databases provide pivot; second, even if all databases provide pivot, What if you would like another pivot after you aggregate data from multiple databases? That’s the pivot of esProc.
Let’s look at how the pivot of esProc works:
| A | |
|---|---|
| 1 | =connect("orcl") |
| 2 | =A1.query("select CLASS, SUBJECT,max( SCORE) THE_HIGHEST_SCORE from STUDENTSCORE group by CLASS, SUBJECT") |
| 3 | =A2.pivot(CLASS; SUBJECT, THE_HIGHEST_SCORE; "Maths":"MAX_MATHS", "English":"MAX_ENGLISH", "Chinese":"MAX_CHINESE") |
Code description:
A1: Connect the database
A2: Extract data for preprocessing (This step can be further extended to complex calculations such as summing up or aggregation. For specific methods, please refer to the relevant articles.)
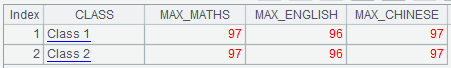
A3: Implementing pivot column-to-row transposition and presenting it, the effect is exactly the same as that of Oracle pivot.
3. Other usage of Pivot
In addition to data presentation requirements, when rows are converted to columns, you can also implement inter-column calculation. Because the properties of columns and rows are different, some calculations between columns will be more cumbersome to implement between rows. For example, the weights of the three subjects of mathematics, English and Chinese are 0.6, 0.3 and 0.1. The average scores of the three subjects of two classes are used to calculate the evaluation indexes.
| A | |
|---|---|
| 1 | =connect("orcl") |
| 2 | =A1.query("select CLASS, SUBJECT,avg( SCORE) AVG_SCORE from STUDENTSCORE group by CLASS, SUBJECT") |
| 3 | =A2.pivot(CLASS; SUBJECT, AVG_SCORE; "Maths", "English", "Chinese") |
| 4 | =A3.new(CLASS, ( Maths *0.6+ English *0.3+ Chinese *0.1): Assessment ) |
Calculation result:

The above calculation, if it is to be implemented between the rows, will be a lot of trouble, interested students can try it on their own.
Column to row
1. Database unpivot
If there is row-to-column transition, there will be column-to-row transition naturally. Take Oracle for example, which provides unpivot as a column-to-row function. What is the business significance of the function of column-to-row transfer? Let’s look at such a personalScore table:
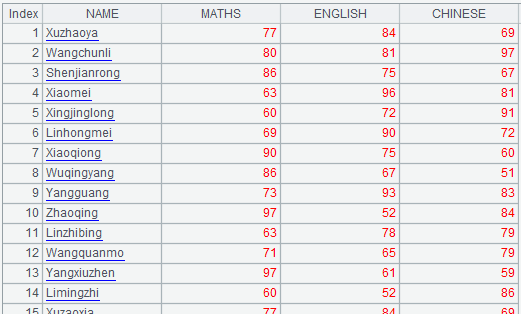
If you want to know which subject each student is best at (that is, which subject has the highest score of each student), it would be convenient to use Max function in inter-row calculation, while it would be relatively cumbersome to use inter-column calculation. Then the unpivot function comes in handy:
    with T1 as (select * from PERSONALSCORE unpivot (SCORE for SUBJECT in ( MATHS, ENGLISH, CHINESE))),
         T2 as (select NAME NAME, max( SCORE) The_Highest_Score  from T1 group by NAME )

    select T1. NAME  NAME, T1. SUBJECT  Good_Subject, T2. The_Highest_Score Good_Score_Score
    from T1 join T2
    on T1. NAME = T2. NAME and T1. SCORE =T2. The_Highest_Score
2. esProc pivot@r
So what if the database used is not Oracle? Do we need to study the details of transposition in the new database? What if the database does not support transpose statements? Do we need to use case when or sub-query to indirectly implement similar functions?
Don’t be so worried! Because we have esProc:
| A | |
|---|---|
| 1 | =connect("orcl") |
| 2 | =A1.query("select * from PERSONALSCORE") |
| 3 | =A2.pivot@r(NAME; SUBJECT, SCORE; MATHS:"MATHS", ENGLISH:"ENGLISH", CHINESE:"CHINESE") |
| 4 | =A3.group(NAME).(~.top@1(-1; SCORE)) |
| 5 | =A4.new(NAME,SUBJECT: Good_Subject, SCORE: Good_Subject_Score) |
The results of calculation are the same (there may be slight difference in sequencing):

In addition, it should be noted that unpivot of database is not the inverse operation of pivot completely, because the pivot statement often contains aggregation function, and aggregation calculation itself is irreversible, that is to say, unpivot can not restore the aggregated results of pivot back to the original detailed data. But because the pivot of esProc does not participate in aggregation computation (aggregation computation has been performed separately before the pivot execution), the pivot@r of esProc can be said to be the inverse operation of the pivot operation of esProc.
Advanced
Bidirectional transposition
Sometimes more complex transposition operations are needed, for example there is a student score table as follows:
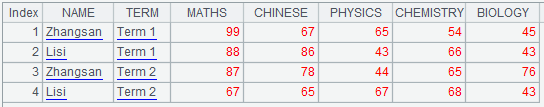
And we want to get a student score table similar to the following structure (meaning to look at the changing trend of a student’s performance in a subject):
| NAME | SUBJECT | TERM 1 | TERM 2 |
|---|---|---|---|
| Zhangsan | MATHS | 99 | 87 |
Here, first of all, we need to merge mathematics, Chinese and other columns into subject column, which need column-to-row operation; and to split term column into term one and term two columns, we need row-to-column operation.
Considering that the structure of the data table is generally that the number of rows is much larger than the number of columns, we can do row-to-column conversion first, and then row-to-column conversion. Since the original data of this table can be one-to-one correspondence between the data after conversion and the data before conversion (no aggregation is required), it is obviously more convenient to use pivot@r and pivot functions of esProc.
| A | |
|---|---|
| 1 | =connect("orcl") |
| 2 | =A1.query("select * from SCORE") |
| 3 | =A2.pivot@r(NAME, TERM; SUBJECT, SCORE) |
| 4 | =A3.pivot(NAME, SUBJECT; TERM, SCORE) |
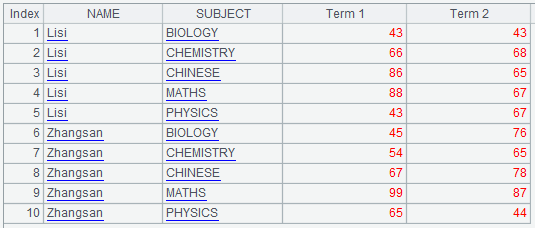
The results:
Dynamic column transposition
The examples given above are static transposes, and the tables and data required to be processed are “well-behaved”. But in the actual business, there are always some unruly aliens, and I believe that there are still a lot of them. In this case, using SQL, whether pivot / unpivot, case when, or anything else, is a little weak… What should we do then? At this time, the advantages of esProc are reflected:
For example, there is a personal income table as follows:

But we want to get a table similar to the following structure:
MANE INCOME_SOURCE_1 INCOMR_AMOUNT_1 INCOME_SOURCE_2 INCOMR_AMOUNT_2 ……
Zhangsan Wages 8000 Stock 6000 ……
We are not sure about the number of columns, or even the names of columns, after row-to-column transitions. At this point, pivot functions that only apply to static transposes can not be used, but dynamic transposes are needed. esProc’s SPL language is much more flexible than the SQL language in dynamic programming:
| A | B | |
|---|---|---|
| 1 | =connect("orcl") | |
| 2 | =A1.query("select * from PERSONALINCOME").group(NAME) | |
| 3 | =A2.max(~.len()) | |
| 4 | =create(NAME, ${A3.("INCOME_SOURCE_"+string(~)+", INCOME_SOURCE_"+string(~)).concat@c()}) | |
| 5 | for A2 | =A5. NAME |A5.conj([INCOME_SOURCE, INCOME_AMOUNT]) |
| 6 | >A4.record(B5) | |
The results: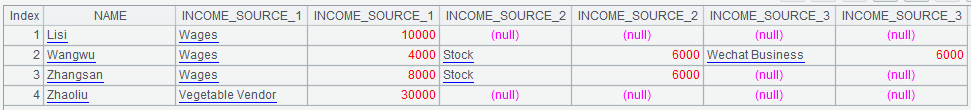
Inter-column calculation at transposition
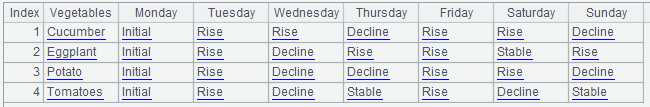
Suppose I have a price list of vegetables for each day of the week.
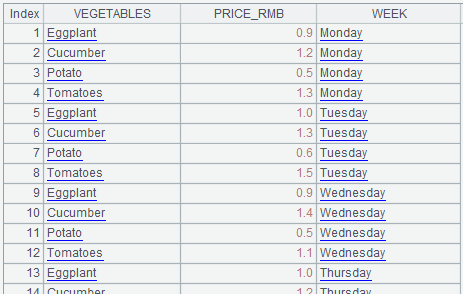
And I want to calculate the price trend of all kinds of vegetables in a week, which includes four states: rise, decline, stable and initial (Monday value).
The table structure is designed as follows:
VEGETABLES Monday Tuesday Wednesday Thursday ……
Eggplant Initial Rise Decline Rise ……
Cucumber Initial Rise Rise ……
……
Although the transposes that need to be used belong to the static type, inter-column calculation need to be implemented during the transposes. This calculation is very troublesome for SQL. But it would be much easier to use esProc SPL language which is more flexible:
| A | B | |
|---|---|---|
| 1 | =connect("orcl") | =["Monday","Tuesday","Wednesday","Thursday","Friday","Saturday","Sunday"] |
| 2 | =A1.query("select * from VEGETABLEPRICES") | |
| 3 | =create(Vegetables, Monday, Tuesday, Wednesday, Thursday, Friday, Saturday, Sunday) | |
| 4 | for A2.group(VEGETABLES) | =A4.align(B1, WEEK) |
| 5 | =B4.(if(#==1:"Initial", PRICE_RMB > PRICE_RMB [-1]:"Rise", PRICE_RMB < PRICE_RMB [-1]:"Decline",PRICE_RMB = PRICE_RMB [-1]:"Stable")) | |
| 6 | >A3.record(A4.VEGETABLES |B5) | |
The following table is obtained for “Price trend of vegetables in a week”:
Summary
Compared with pivot and unpivot provided by SQL, the transposition function provided by esProc SPL language is more flexible and adaptable, which can meet various complex transposition requirements.
SPL Official Website 👉 http://www.scudata.com
SPL Feedback and Help 👉 https://www.reddit.com/r/esProc
SPL Learning Material 👉 http://c.scudata.com
SPL Source Code and Package 👉 https://github.com/SPLWare/esProc
Discord 👉 https://discord.gg/ydhVnFH9
Youtube 👉 https://www.youtube.com/@esProc_SPL

