

Python vs. SPL 5 -- Order-related Operation
We are naturally interested in order-related operations which include calculating the rate of last period or YOY. This article is focused on comparing the order-related operations between Python and SPL.
Sorting
Sorting is the most common order-related operation, for example:
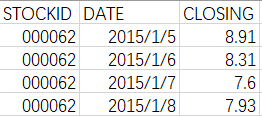
Sort stock 000062 by date.
The data of the stock are as follows:
Python
import pandas as pd stock_file="D:/data/STOCKS.csv" stock_data=pd.read_csv(stock_file,dtype={'STOCKID':'object'}) stock_62=stock_data.query('STOCKID=="000062"').copy() stock_62["DATE"]=pd.to_datetime(stock_62["DATE"]) stock_62.sort_values(by="DATE",inplace=True) print(stock_62) |
Import pandas The path of stock data Load the stock data Select the stock Convert the data type of date Sort by date
|
Pandas provides the sort_values function to sort a certain column, and the function is very easy to operate.
SPL
A |
B |
|
1 |
D:\data\STOCKS.csv |
/the path of stock data |
2 |
=file(A1).import@tc(#1:string,#2,#3) |
/load the stock data |
3 |
=A2.select(STOCKID=="000062") |
/select the stock |
4 |
=A3.run(DATE=date(DATE,"yyyy/MM/dd")) |
/add the rate of rising/falling |
5 |
=A3.sort(DATE) |
/sort |
SPL uses the sort(...) function to perform the sorting.
Occasionally we need to sort multiple columns in different directions, for example:
Sort all the stock data by code in ascending order and price in descending order.
Python
#continue to use stock_data stock_sort2key=stock_data.sort_values(by=["STOCKID","CLOSING"],ascending=[1,0]) print(stock_sort2key) |
Sort multiple columns in different directions
|
In the sort_values() function, the “by” and “ascending” parameters support multiple columns and sorting in different directions respectively, which is relatively easy.
SPL
A |
B |
|
… |
/A2 is the stock information |
|
7 |
=A2.sort(STOCKID,-CLOSING) |
/load the stock data |
SPL still uses the sort(...) function to perform multiple keys sorting in different directions, which is equally convenient.
The position/index after sorting
The position information after sorting is also very important and may be used sometimes. For example:
Calculate the rising rate of the three highest stock (code: 000062) prices.
Python
#continue to use stock_62 sort_pos=(-stock_62["CLOSING"]).argsort() max3pos=sort_pos.iloc[:3] stock_62s=stock_62.shift(1) max3CL=stock_62["CLOSING"].iloc[max3pos] max3CLs=stock_62s["CLOSING"].iloc[max3pos] max3_rate=max3CL/max3CLs-1 print(max3_rate) |
Return the positions after sorting in reverse order by CLOSING Select the first 3 positions Move the stock information down for one line The prices of the three highest CLOSING The prices one day before the three highest CLOSING The rising rates of the three highest CLOSING
|
The argsort(...) function in Python returns the position information after sorting. Since neither is there loop function in Python nor can we use the position information to calculate in the loop, we can only first find the three highest stock prices, then find the stoke prices of the day before the three highest ones, and calculate both to get the rising rate, which is a bit convoluted and burdensome.
SPL
A |
B |
|
… |
/A3 is the stock information of stock 000062 |
|
9 |
=A3.psort@z(CLOSING) |
/the sorting positions of stock prices |
10 |
=A9.m(:3) |
/select the first 3 positions |
11 |
=A3.calc(A10,if(#==1,null,CLOSING/CLOSING[-1]-1)) |
/calculate the rising rate by position |
The psort(...) function in SPL returns the position information from the smallest to largest, and @z option indicates the reverse order. The calc(...) function is a positioning calculation, which uses the position and relative position of the members to perform the calculation. CLOSING[-1] indicates the previous member of the current member.
We can also use the ptop(...) function to calculate the position information of the three highest stock prices, which spares a full sorting and is more effective. The code is rewritten as follows: A9 is no longer needed; A10=A3.ptop(-3,CLOSING); A11 calculates as normal.
By extension, what do Python and SPL do when we need to use multiple columns of position information in different directions?
Calculate the position/index after sorting by the stock code in ascending order and stock price in descending order.
Python
#continue to use stock_data import numpy as np sort2key_pos=np.lexsort((-stock_data["CLOSING"],stock_data["STOCKID"])) print(sort2key_pos) |
Import numpy The sorted positions/indexes of multiple columns in different directions
|
Here Python uses another new function, lexsort(...), which is not in Pandas but Numpy library. The normal logic is to first sort by STOCKID in ascending order and then by CLOSING in descending order, usually the order of importance descending from left to right, but Python has to put the first-sorted STOCKID at the end, followed by CLOSING; if three or more columns need to be sorted, the importance will be descended from right to left, which is against the natural logic. In addition, this function has no parameter for reverse order which can only be represented by a minus sign “-”. However, Python dose not support the minus sign on strings, which will report an error if there exists one. Therefore, the lexsort() function will not work if the calculation is to sort by STOCKID in descending order and by CLOSING in ascending order, we have to use another method. You can try the following code and find what will happen in Python:
np.lexsort((stock_data["CLOSING"],-stock_data["STOCKID"]))
SPL
A |
B |
|
… |
/A2 is the stock information |
|
13 |
=A2.psort(STOCKID,-CLOSING) |
/the sorted positions/indexes of multiple columns in different directions |
In SPL, the whole calculation is much more easier. Like the sort function, the psort()function is used to return the sorted positions naturally. And SPL supports the minus sign in strings (-STOCKID is sorted in reverse order).
Adjacent record reference
During data analysis, we often refer to the adjacent records in a certain order to calculate. For example:
Calculate the daily rate of rising/falling for stock 000062.
Python
#continue to use stock_62 of the previous example stock_62s=stock_62["CLOSING"].shift(1) stock_62["RATE"]=stock_62["CLOSING"]/stock_62s-1 print(stock_62) |
The closing price of the previous day Calculate the rate of rising/falling
|
The shift(n) function in Python moves n rows of data, and the parameter n can be a positive or negative number, for instance, 1 is to move down one row; -1 is to move up one row. In this way, we can use the moved data to calculate with the current row.
SPL
A |
B |
|
… |
/A3 is the stock information of stock 000062 |
|
15 |
=A3.derive(if(#==1,null,CLOSING/CLOSING[-1]-1):RATE) |
/add the rate of rising/falling |
In SPL, the CLOSING[-1] in the loop function is the CLOSING value of the record that is 1 unit before the current record (i.e., the previous record), CLOSING[-1]=~[-1].CLOSING, which is the same as CLOSING[-1] in the above example.
SPL uses the relative positions to perform such operations and does not move all the rows like Python, which is simple in syntax and effective in performance.
Moving average is also a common operation, for example:
Calculate the moving average of 5 consecutive trading days for stock 000062.
Python
#continue to use stock_62 stock_62["MAVG"]=stock_62["CLOSING"].rolling(5,min_periods=1).mean() print(stock_62) |
Calculate the moving average |
The rolling() function can calculate the moving average easily, and the result is an object, which needs to be followed by an aggregation function subsequently. If following function is “mean”, it calculates the moving average; if “sum” function follows, it calculates the moving sum. And “object” is a bit difficult to understand. In addition, although calculating the average of the previous row and the 5 adjacent rows is the same kind of operation, Python actually uses two unrelated functions, “shift” and “rolling” respectively, to calculate them.
SPL
A |
B |
|
… |
/A3 is the stock information of stock 000062 |
|
17 |
=A3.derive(CLOSING[-4:0].avg():DAY5) |
/moving average |
SPL still uses the form of CLOSING[...] to implement the calculation except that [-4:0] indicates all the records from the previous 4th rows to the current row. CLOSING[-4:0]=~[-4:0].(CLOSING). The form of adjacent record reference is accordant and very easy to understand and memorize. This is also consistent with the use of ~[...] in sequence, which is described in the “Adjacent reference” section of Python vs. SPL -- Loop Function.
Summary
There are abundant functions about order-related operations in Python, but they are relatively simple and rough. For instance, there is no relative positions, and the functions have to move the whole data up or down or even use an object to replace them; the functions for calculating positions are also weak, some of which need to be hard-coded or “detoured”, making both coding and executing much less efficient. These functions are designed chaotically and difficult to memorize.
On the contrary, SPL performs professionally in terms of order-related operations. It has plenty of functions for order-related operations and gets both absolute and relative positions easily in the loop. The functions are also elaborately designed such as (sort,psort), (select,pselect), (max,pmax,maxp), (top,ptop), etc., and they are similar in syntax and form, so using them is like building Legos. It is easy to write all kinds of complex code (houses, airplanes and other complex shapes) after knowing a few atomic functions (basic block shapes).
SPL Official Website 👉 http://www.scudata.com
SPL Feedback and Help 👉 https://www.reddit.com/r/esProc
SPL Learning Material 👉 http://c.scudata.com
SPL Source Code and Package 👉 https://github.com/SPLWare/esProc
Discord 👉 https://discord.gg/ydhVnFH9
Youtube 👉 https://www.youtube.com/@esProc_SPL


Chinese version