

Automatic labeling of customer groups
Customer information labeling, also known as customer profiling, refers to the process of collecting data from various dimensions such as customers’ social attributes, consumption habits, and preference characteristics, and then characterizing customer or product characteristic attributes. These characteristics are analyzed and statistically analyzed to explore potential value information, thus abstracting the full picture of customer information.
From the way customers are labeled, there are generally three types: ① Statistical labels; ② Rule-based labels; ③ Machine learning mining labels (predictive labels).
① Statistical labels
This type of label is the most basic and common type of label. For example, for a certain customer, its gender, age, city, constellation, active time in the past 7 days, active days in the past 7 days, and active times in the past 7 days can be calculated from customer login data, customer visits, and consumption data. This type of label forms the foundation of customer profiling.
② Rule-based Labels
This type of label is generated based on customer behavior and established rules. For example, the definition of “active consumer” on the platform is “transaction times in the past 30 days ≥ 2”. In the actual development process of the profiling, due to the fact that operators are more familiar with the business, while data personnel are more familiar with the structure, distribution, and characteristics of the data, the rules for labels are jointly negotiated and determined by operators and data personnel;
③ Machine learning mining labels (predictive labels)
This type of label is generated through machine learning mining and used to predict and judge certain attributes or behaviors of customers. For example, determining whether a customer is male or female based on their behavioral habits, and determining their level of preference for a certain product based on their consumption habits. This type of label needs to be generated through algorithm mining.
In practical engineering, there are generally more statistical and rule-based labels, while machine learning labels have a relatively small proportion due to their long development cycle and high development costs. But with the end of the traffic dividend, enterprises and merchants have gradually shifted from the era of customer acquisition to the era of competing services. How to increase customer stickiness and generate more value through more refined management and precise services for customers has become a new driving force. The labels generated from simple statistics and rules in many scenarios no longer meet the requirements and require more accurate predictions. For example, the customer’s sensitivity to price, preference for color, preference for sports, and whether the customer is a geek or loser, an expert or rookie, or an IT otaku or a fashioner. For another example, it is also possible to predict customers’ purchase intention, repurchase intention, etc. for different products, and then label them with different labels to achieve different ways of management and marketing for customers at different levels; In the field of risk control, predicting the risk level of customers can achieve more accurate risk control. In short, with the demand for refined management and services, data mining labels are playing an increasingly important role.
As mentioned earlier, data mining labels are difficult to popularize due to their high development costs and long cycles. This is because the algorithm principles and parameters used in data mining are relatively difficult, requiring the participation of data scientists, who are scarce and expensive; In the meanwhile, building a data mining model is not an overnight task and requires data experts to repeatedly debug based on their own knowledge and experience. Building a model can range from weeks to months. Not to mention that the model has a lifecycle, and if the data changes, the model needs to be rebuilt. In many business scenarios, there is a window period for product sales, such as the sale of summer cold drinks, which is only a short one or two months. When the model is finally deployed and launched, summer is almost over. Wait until next year, the consumption pattern may have changed: last year, ice cream assassins were popular, and this year, affordable ice cream was popular. The model needs to be rebuilt.
Yet what is expected is that technology is constantly improving. In recent years, with the development of AI technology, automated modeling technology has become very mature. Automatic modeling technology integrates the knowledge and experience of data scientists into some software tools. With the help of the tools, you do not need to master complex algorithm principles and parameters and can build models. And the efficiency of automatic modeling is much higher than that of manual work. With tens of thousands of pieces of data, a model can be built in just a few minutes. Using automatic modeling technology, it is no longer difficult to label by data mining (prediction). By throwing the organized data in, automatic modeling and labeling can be achieved. Both development costs and cycles have significantly decreased.
For example, SPL is very useful as it has a very professional automatic modeling library called Ymodel. In SPL, automatic modeling can be achieved through simple function invocations.
For example, a certain platform has some basic customer information (gender, age, occupation, income, etc.), historical consumption data, login and browsing behavior data, as well as historical purchase information data for a certain product. These data can be used to model and predict the customer’s purchase intention for the product. The SPL code is as follows:
| A | ||
|---|---|---|
| 1 | =file(“train.csv”).import@tc() | |
| 2 | =ym_env() | Initialize environment |
| 3 | =ym_model(A2,A1) | Load modeling data |
| 4 | =ym_target(A3,“y”) | Set prediction target |
| 5 | =ym_build_model(A3) | Perform modeling |
View model performance:
| A | ||
|---|---|---|
| … | ||
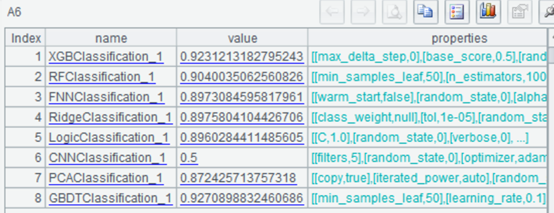
| 6 | =ym_present(A5) | Viewing model information |
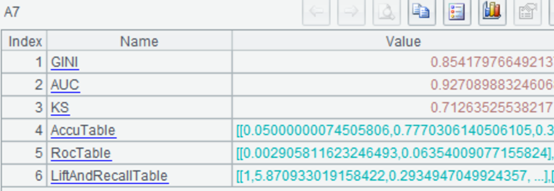
| 7 | =ym_performance(A5) | View model performance |
| 8 | =ym_importance(A5) | View variable importance |

Use the model to predict the probability of each customer purchasing the product:
| A | ||
|---|---|---|
| … | ||
| 9 | =ym_predict(A5,A1) | Execute predictions |
| 10 | =ym_result(A9) | Obtain prediction results |

The predicted result is a probability value between 0 and 1, and the higher the probability, the more likely it is to purchase the product. Customers can be labeled based on the value, which can be divided into two levels: high and low, or multiple levels: high, medium, and low. Then, business personnel can implement targeted marketing strategies based on customers with different labels, such as increasing promotional activities for swing mid to low end customers to increase their purchase rate. Using algorithms to predict labels takes into account more dimensions and is much more accurate than simple statistics or rules.
Of course, there are many labels that also have a lifecycle, such as customers who were still students in the first few months and became white-collar workers in the workplace after graduation season. Therefore, it is generally necessary to re model and update the labels after a period of time. With SPL automatic modeling, model iteration is much easier. As long as the triggering conditions are set, such as a fixed time of one month or a decrease in model accuracy to a certain value, the model will automatically run well, directly saving the cost of rebuilding the model.
For a more complete data mining process, you can refer to: Data mining, modeling and prediction in SPL
In addition to helping for algorithm prediction label, SPL itself is also a tool that is good at structured data computing. It has rich computing functions and excellent big data computing ability. It is even easier to use it for label statistical and rule-based labels, and has unique advantages in computing in many complex scenarios. For details, please refer to The ‘Artificial’ in Artificial Intelligence
SPL Official Website 👉 http://www.scudata.com
SPL Feedback and Help 👉 https://www.reddit.com/r/esProc
SPL Learning Material 👉 http://c.scudata.com
SPL Source Code and Package 👉 https://github.com/SPLWare/esProc
Discord 👉 https://discord.gg/ydhVnFH9
Youtube 👉 https://www.youtube.com/@esProc_SPL


Chinese version