

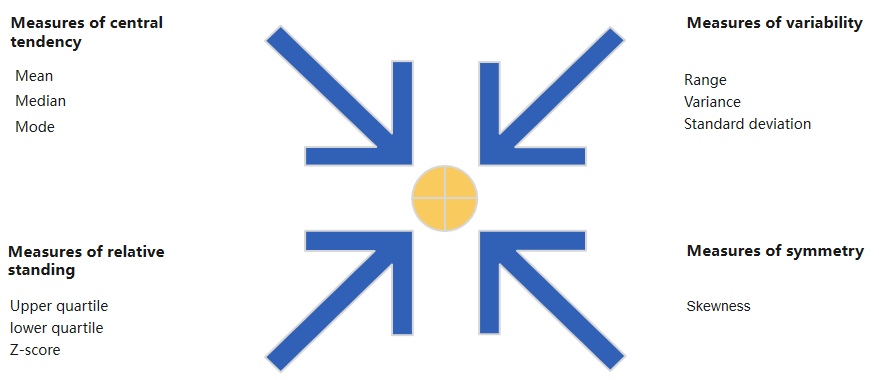
Numerical data
Numerical data is quantitative data, which can be explored and analyzed from the following dimensions.
For example, there is a numerical variable "Age" in the Titanic data which indicating the age of the passengers.
Analyse in SPL:
A |
||
1 |
=file("D://titanic.csv").import@qtc() |
|
2 |
=A1.(Age) |
|
3 |
=A2.max() |
|
4 |
=A2.min() |
|
5 |
=A2.avg() |
|
6 |
=A2.mode() |
|
7 |
=A2.median() |
|
8 |
=A2.median(1:4) |
|
9 |
=A2.median(3:4) |
|
10 |
=var@s(A2) |
|
11 |
=sqrt(A9) |
|
12 |
=A2.skew() |
|
13 |
=A2.se() |
|
14 |
8 |
|
15 |
=(A2.max()-A2.min())/A14 |
|
16 |
=A14.([(~-1)*A15+A2.min(),~*A15+A2.min()]) |
|
17 |
=A16.new(~:group,(~(1)+~(2))/2:group_median, if(#==A16.len(),count(A2.(~>=group(1)&&~<=group(2))),count(A2.(~>=group(1)&&~<group(2)))):count) |
|
18 |
=canvas() |
|
19 |
=A18.plot("EnumAxis","name":"x") |
|
20 |
=A18.plot("NumericAxis","name":"y","location":2) |
|
21 |
=A18.plot("Column","text":A17.(count),"axis1":"x","data1":A17.(string(group_median)),"axis2":"y","data2":A17.(count)) |
|
22 |
=A18.draw@p(800,450) |
|
23 |
||
24 |
=A1.impute("Age") |
[0.25,0.5,0.75] |
25 |
=A24(1).sort() |
=A25(1) |
26 |
=A25.(#/A25.len()) |
=A25.m(-1) |
27 |
=canvas() |
|
28 |
=A27.plot("NumericAxis","name":"x","autoCalcValueRange":false,"maxValue":1,"scaleNum":10,"allowRegions":false) |
|
29 |
=A27.plot("NumericAxis","name":"y","location":2,"autoCalcValueRange":false,"autoRangeFromZero":false,"maxValue":A25.m(-1),"minValue":A25(1)) |
|
30 |
=A27.plot("Line","lineColor":-16776961,"markerWeight":1,"axis1":"x","data1":A26,"axis2":"y","data2":A25) |
|
31 |
for B24 |
=A27.plot("Line","lineStyle":2,"lineColor":-65281,"markerWeight":-1,"axis1":"x","data1":[A31,A31],"axis2":"y","data2":[B25,B26]) |
32 |
=A27.draw@p(800,400) |
A2-A9 Calculate the basic statistics of the variable, maximum, minimum, mean, mode, median, quartile
A10-A13 Calculate the variance, standard deviation, skewness and standard error.
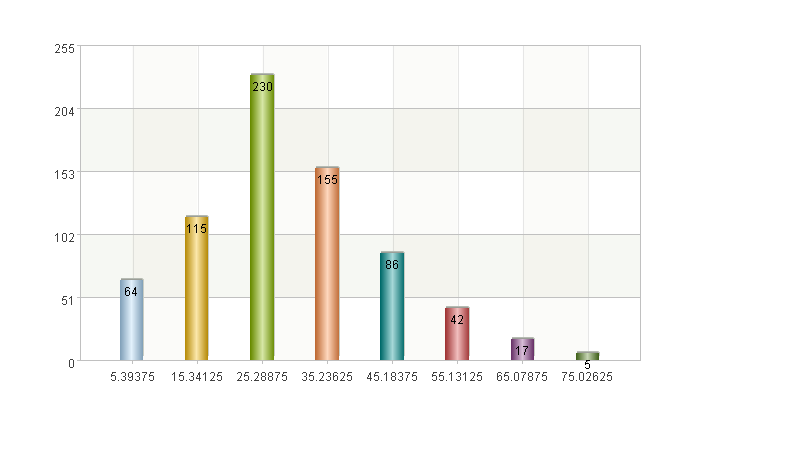
For numerical variables, you can also visualize the data, the most common being a histogram
A14-A22 Draw a histogram. Before drawing, it is necessary to determine the number of columns, and then equidistant grouping the variable. Count the number of samples falling into each group interval (column)
A14 Input the number of columns is 8.
A15 Calculate the width of each column
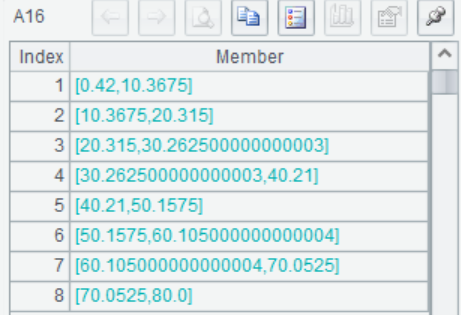
A16 Divide the samples into 8 groups, return the range of intervals for each group, approximately every 10 years.
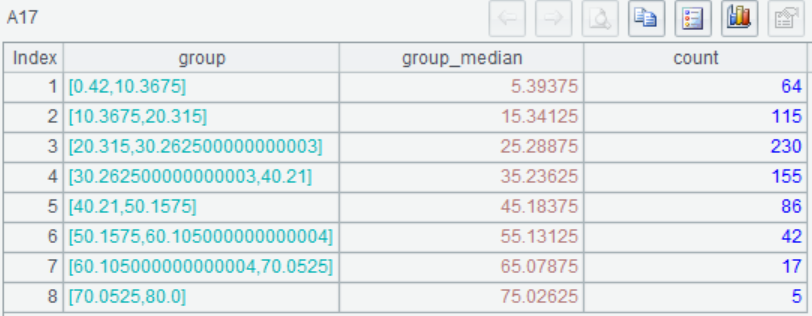
A17 Calculate the median for each group and the number of passengers who fall into that group, such as the first group of 64 passengers from 0 to 10 years old.
A18-A22 Using the A17 data to plot histogram, you can see the distribution of each group.
Numerical variables can also be represented by quantile plots
A24-A32 Plot a quantile of the variable Age

SPL Official Website 👉 http://www.scudata.com
SPL Feedback and Help 👉 https://www.reddit.com/r/esProc
SPL Learning Material 👉 http://c.scudata.com
SPL Source Code and Package 👉 https://github.com/SPLWare/esProc
Discord 👉 https://discord.gg/ydhVnFH9
Youtube 👉 https://www.youtube.com/@esProc_SPL

