

The very tool to liberate an Excelman from working overtime - ReportLite
Excel is currently the most widely used spreadsheet tool in the workplace, with a large number of professionals in various industries using it to draw tables and perform data analysis. Without Excel, many workplace personnels cannot work properly.
However, Excel is not perfect either. Its automation ability is relatively weak, and the implementation of tables with complex formats is too cumbersome or impossible. Tables with simple formats that involve frequent data changes can also bring a lot of workloads, becoming a nightmare for an Excelman. Working overtime is unavoidable.
So, let’s take a look at how to use the report tool ReportLite to quickly solve the table making difficulties encountered in the workplace.
Making reports repetitively
For example, there is a set of sales data:
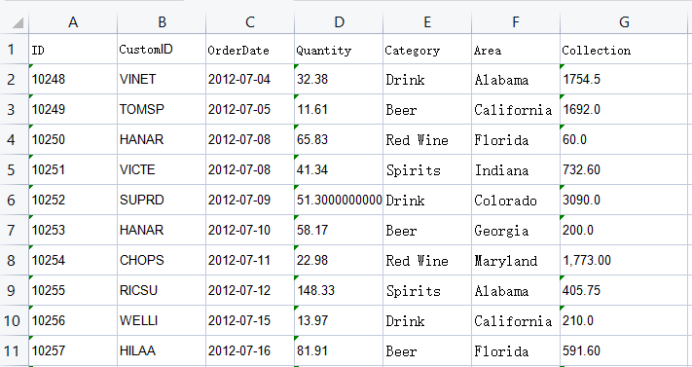
It is required to list the detailed payment data based on these data and summarize the payment data as follows:

For reports with simple formats, processing in Excel is also very simple. Import data, sum cells, and then set the format.
However, this report needs to be done once a month, and next month it’s not just about updating the data. The data may change, there may be more rows, and the order of the columns may also be different. If you always do it manually, in addition to changing the data, you also need to adjust the column order and change the expression of the summary cell. A lot of repetitive work makes it very difficult to make a simple report.
Then how would ReportLite do?
Just use the wizard to select a data file and create a template like this:


When the data changes next month, just reselect the data file and regenerate it. Isn’t it simple and convenient?
Making Complex reports
Sometimes we also need to create multi-level group and cross reports with complex formats. In Excel, we can use a pivot table to implement grouping and summary, but the result can only be displayed according to a fixed layout, often not the result we want. Drawing a multi-level report like this can be quite tedious.

Using a pivot table to create it looks like this:

The style of a pivot table is very rigid, with merge cells that cannot be done, slashes in the table header that cannot be added, and the ability to insert some rows and columns that are not allowed. There are too many restrictions.
The summary of amounts and the count of orders belong to the same group. It will be more convenient to view the data by creating a consolidation cell at the border of that group. A diagonal line in the header can provide a more intuitive understanding of the meaning of different areas in the report result, which cannot be achieved with a pivot table. Although it is possible to manually add a few more rows to make a fixed header, this method is also not feasible if the data changes and needs to be redone.
Using ReportLite is much simpler, as its template will automatically grow, making it much more convenient than Excel:

The style settings in ReportLite are very flexible, and amounts and quantities belonging to the same group can be directly merged into cells. There are no restrictions on header slashes, row and column insertion, and you can set them as needed.
Row and column conversion is also a common task, such as converting

into:

This is a crosstab, but it looks like this when using an Excel pivot table:

The ID and Name will be displayed in a hierarchical manner, and cannot be displayed as two columns horizontally side by side. The format can only be manually adjusted. It’s okay if the data amount is small, but if the data amount is large, this format adjustment can also drive people crazy.
Using ReportLite is much simpler, just create a template:

Then one click, and it’s done.
Multiple Table Association
The following table aims to display data from different files together.

Sales and Cash data are stored in different data files, and the report requires that both Sales and Cash data be visible when displayed, and those with the same area should be displayed in one row.
How to do it in Excel? You can create two pivot tables for different data files, and then use VLOOKUP to associate the two tables based on area. However, in this multi column association situation, writing VLOOKUP multiple times is too cumbersome, and the categories may change, and so will the number of columns, making it difficult to implement.
In ReportLite, the association between the tables is much easier to handle:

ReportLite can read multiple data files at the same time, making this a simple cross report. When it comes to association, just use built-in formulas to set it, just a few cells, and it’s done.
Summary
1. ReportLite has higher efficiency in making reports while being fearless of data changes; Strong processing ability for complex reports, able to meet various table requirements; The association processing between multiple tables is also simpler.
2. ReportLite adopts an Excel like design approach, which is easy to operate and has low learning costs. There are downloadable learning tutorials available on http://www.raqsoft.com/reportlite . Moreover, Excel files and ReportLite files can be converted to each other, avoiding some repetitive work.
SPL Official Website 👉 http://www.scudata.com
SPL Feedback and Help 👉 https://www.reddit.com/r/esProc_Desktop/
SPL Learning Material 👉 http://c.scudata.com
Discord 👉 https://discord.gg/ydhVnFH9
Youtube 👉 https://www.youtube.com/@esProcDesktop
Linkedin Group 👉 https://www.linkedin.com/groups/14419406/


Chinese version