

SPL Programming Exercise - Chapter 10 Association
10.1 Primary key
1. Sales data is as follows:
| ID | Name | Sales |
|---|---|---|
| 010010001 | Tom | 7,588,420 |
| 010010002 | John | 8,953,172 |
| 010010003 | Joan | 6,276,185 |
| 020010004 | Rocky | 1,281,280 |
| 020010005 | Ham | 2,686,043 |
| 020010006 | Kate | 5,851,210 |
| 020010007 | Rose | 292,254 |
| 030020008 | Nomy | 8,216,267 |
| 030020009 | Neil | 5,143,192 |
(1) Set ID as primary key
(2) Find the primary key value of the second record
(3) Establish an index for the primary key
(4) Search for records with primary key values of 10010002,20010004,30020008
(5) Delete primary key
(6) Set ID and Name as primary keys
(7) Search for the record with the primary key values of 20010005 and “Ham”
10.2 Foreign key
1. There are tables of Person and Address as follows
Age Table
| personId | lastName | firstName |
|---|---|---|
| 1 | Wang | Allen |
| 2 | Alice | Bob |
personId is the primary key of the table
This table contains information about some people’s IDs and their last and first names.
Address Table
| addressId | personId | city | state |
|---|---|---|---|
| 1 | 2 | New York | New York |
| 2 | 3 | Los Angeles | California |
addressId is the primary key of the table
Each row of the table contains information about the city and state of a person with ID=PersonId
(1) Using the switch function, with Address as the fact table, convert the foreign key field to the corresponding dimension table record, and set it to null when the corresponding record does not exist.
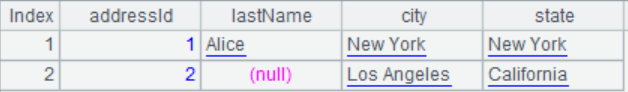
(2) Add the lastName from the dimension table record to the table Address, and the effect is as follows:
2. Identify the list of customers who have purchased a certain product using the Customers and Orders tables (using switch and join methods)
Customers Table
| id | name |
|---|---|
| 1 | Joe |
| 2 | Henry |
| 3 | Sam |
| 4 | Max |
Orders Table
| id | customerId | amount |
|---|---|---|
| 1 | 3 | 787 |
| 2 | 1 | 675 |
| 3 | 3 | 203 |
3. Find the list of customers who have not purchased the product in the Customers and Orders tables in question 2
4. The employee salary table and department table are as follows. Find the highest paying employees and their salary in each department
Employee
| id | name | salary | departmentId |
|---|---|---|---|
| 1 | Joe | 70000 | 1 |
| 2 | Henry | 90000 | 1 |
| 3 | Sam | 80000 | 2 |
| 4 | Max | 60000 | 2 |
| 5 | Jim | 90000 | 1 |
Department
| id | name |
|---|---|
| 1 | IT |
| 2 | Sales |
Note that there may be more than one employee with the highest salary
5. The customer order table and order details table are as follows:
Orders
| OrderID | Customer | Area | Orderdate |
|---|---|---|---|
| 1001 | Tom | west | 2020/2/5 |
| 1002 | Jack | south | 2020/2/5 |
| 1003 | Tim | east | 2020/2/5 |
| 1004 | Rose | north | 2020/2/6 |
| 1005 | Kate | east | 2020/2/6 |
| 1006 | John | south | 2020/2/7 |
| 1007 | Horn | north | 2020/2/7 |
Order_detail
| OrderID | Index | Product | Price | Quantity |
|---|---|---|---|---|
| 1001 | 1 | p1 | 12.5 | 32 |
| 1001 | 2 | p2 | 14.3 | 55 |
| 1001 | 3 | p3 | 15.7 | 14 |
| 1002 | 1 | p1 | 12.5 | 10 |
| 1002 | 2 | p3 | 15.7 | 8 |
| 1003 | 1 | p1 | 12.5 | 36 |
| 1003 | 2 | p4 | 8.8 | 15 |
| 1003 | 3 | p6 | 62.3 | 85 |
| 1004 | 1 | p2 | 14.3 | 24 |
| 1005 | 1 | p3 | 15.7 | 12 |
| 1005 | 2 | p4 | 8.8 | 27 |
| 1006 | 1 | p1 | 12.5 | 18 |
| 1006 | 2 | p4 | 8.8 | 92 |
| 1006 | 3 | p6 | 62.3 | 10 |
| 1007 | 1 | p3 | 15.7 | 6 |
| 1007 | 2 | p5 | 24.8 | 8 |
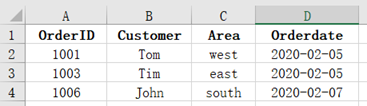
(1) Please find information on customer orders with a total order amount greater than 1000.
Tip: An order contains multiple products, and the total order amount is equal to the total amount of all products in the order.
Result example:
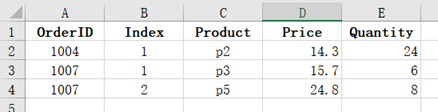
(2) Identify customer order details in the North area.
Result example:
6. The freight standard table and transportation order table are as follows
Freight
| City | First1KG | Add1KG |
|---|---|---|
| Alabama | 12 | 3 |
| Alaska | 11 | 5 |
| Arizona | 11 | 5 |
| Arkansas | 10 | 5 |
| Boston | 12 | 3 |
| California | 10 | 4 |
| Colorado | 10 | 4 |
| Connecticut | 12 | 5 |
Orders
| OID | City | WeightKG |
|---|---|---|
| 100001 | Arizona | 15 |
| 100002 | Arkansas | 13 |
| 100003 | Boston | 11 |
| 100004 | Colorado | 3 |
| 100005 | Connecticut | 2.5 |
| 100006 | Arizona | 8 |
| 100007 | Alabama | 3.6 |
| 100008 | Alaska | 22 |
| 100009 | California | 19 |
According to the freight standard table, calculate the actual freight cost.
Tip: Actual shipping cost=First weight shipping cost+Excess weight * Overweight unit price, where less than 1KG will be calculated as 1KG
7. Employee dining data and meal fee standards are as follows
Meal
| Name | Mealtype |
|---|---|
| Tom | breakfast |
| John | lunch |
| Joan | supper |
| Rocky | breakfast |
| Ham | lunch |
| Kate | supper |
| Rose | breakfast |
| Nomy | lunch |
| Neil | supper |
| Jack | breakfast |
| Joe | lunch |
| Peter | supper |
| Sunny | breakfast |
| Tiger | lunch |
| Alice | breakfast |
| Cindy | lunch |
| Leon | supper |
| Lily | breakfast |
| Kevin | lunch |
| Shelly | supper |
| Panzy | breakfast |
| Maggie | lunch |
| Mark | supper |
| Aileen | breakfast |
Charge
| Mealtype | Mealcharge |
|---|---|
| breakfast | 10 |
| lunch | 15 |
| supper | 20 |
Calculate the meal expenses for each employee in the Meal table.
8. Interval association
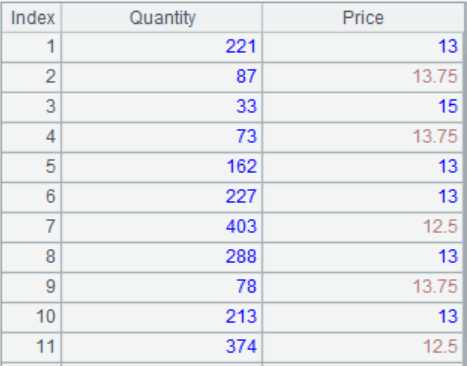
There are a quantity table and a price standard table, calculate the corresponding prices in the quantity table.
Quantity
| Quantity |
|---|
| 221 |
| 87 |
| 33 |
| 73 |
| 162 |
| 227 |
| 403 |
| 288 |
| 78 |
| 213 |
| 374 |
| 152 |
Price
| StartQuantity | EndQuantity | Price |
|---|---|---|
| 0 | 50 | 15 |
| 50 | 100 | 13.75 |
| 100 | 300 | 13 |
| 300 | 500 | 12.5 |
Tip: segp()is the selection function for pseg(), and returns the corresponding member based on the segment number.
Result example:
10.3 Merge
1. The sales order table data for 2018 and 2019 are as follows, and the two sheets have the same column structure:
2018
| OrderID | CustomerID | ProductID | OrderDate | Amount |
|---|---|---|---|---|
| 10248 | VINET | 11 | 2018-07-04 | 168 |
| 10248 | VINET | 42 | 2018-07-04 | 98 |
| 10248 | VINET | 72 | 2018-07-04 | 174 |
| 10249 | TOMSP | 14 | 2018-07-05 | 167.4 |
| 10249 | TOMSP | 51 | 2018-07-05 | 1696 |
| 10250 | HANAR | 41 | 2018-07-08 | 77 |
| 10250 | HANAR | 51 | 2018-07-08 | 1484 |
| 10250 | HANAR | 65 | 2018-07-08 | 252 |
| 10251 | VICTE | 22 | 2018-07-08 | 100.8 |
| 10251 | VICTE | 57 | 2018-07-08 | 234 |
| 10251 | VICTE | 65 | 2018-07-08 | 336 |
| 10252 | SUPRD | 20 | 2018-07-09 | 2592 |
| 10252 | SUPRD | 33 | 2018-07-09 | 50 |
| 10252 | SUPRD | 60 | 2018-07-09 | 1088 |
| 10253 | HANAR | 31 | 2018-07-10 | 200 |
2019
| OrderID | CustomerID | ProductID | OrderDate | Amount |
|---|---|---|---|---|
| 10400 | EASTC | 29 | 2019-01-01 | 2079 |
| 10400 | EASTC | 35 | 2019-01-01 | 504 |
| 10400 | EASTC | 49 | 2019-01-01 | 480 |
| 10401 | RATTC | 30 | 2019-01-01 | 372.6 |
| 10401 | RATTC | 56 | 2019-01-01 | 2128 |
| 10401 | RATTC | 65 | 2019-01-01 | 336 |
| 10401 | RATTC | 71 | 2019-01-01 | 1032 |
| 10402 | ERNSH | 23 | 2019-01-02 | 432 |
| 10402 | VINET | 72 | 2019-01-02 | 2281.5 |
| 10403 | ERNSH | 16 | 2019-01-03 | 291.9 |
| 10403 | ERNSH | 48 | 2019-01-03 | 714 |
| 10404 | HANAR | 65 | 2019-01-03 | 747 |
| 10404 | MAGAA | 42 | 2019-01-03 | 448 |
| 10404 | MAGAA | 49 | 2019-01-03 | 480 |
| 10405 | LINOD | 3 | 2019-01-06 | 400 |
(1) Identify orders from the same customer (customerID) who purchased the same product (ProductID) in the past two years
(2) Merge orders from two years into one table and calculate the total amount for each customer
(3) Identify the order status of new customers in 2019:
(4) Identify the list of all lost customers (customerID) in 2019,
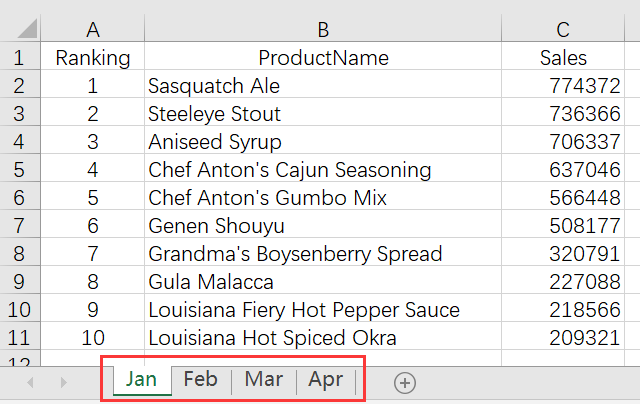
2. The top ten product names and salesperson names in January and February sales rankings:
Jan
| ProductName | Name |
|---|---|
| Sasquatch Ale | Sunny |
| Steeleye Stout | Mark |
| Aniseed Syrup | Peter |
| Chef Anton’s Cajun Seasoning | Sunny |
| Chef Anton’s Gumbo Mix | Mark |
| Genen Shouyu | Mark |
| Grandma’s Boysenberry Spread | Sunny |
| Gula Malacca | Sunny |
| Louisiana Fiery Hot Pepper Sauce | Peter |
| Louisiana Hot Spiced Okra | Peter |
Feb
| ProductName | Name |
|---|---|
| Northwoods Cranberry Sauce | Mark |
| Original Frankfurter grüne So?e | Peter |
| Chef Anton’s Cajun Seasoning | Ben |
| Genen Shouyu | Mark |
| Louisiana Fiery Hot Pepper Sauce | Peter |
| Sasquatch Ale | John |
| Valkoinen suklaa | Mark |
| Zaanse koeken | Peter |
| Camembert Pierrot | Sunny |
| Flotemysost | Mark |
(1) Using the ProductName as the key column, identify the product data that entered the top ten for both January and February (just list the salesperson’s name for January)
(2) Using the ProductName as the key column, identify the product data that entered the top ten once or more in January and February
(3) Using the ProductName as the key column, identify the sales data of products that entered the top ten in January but did not enter the top ten in February
(4) Based on a comparison of the entire row of data, identify the products and salesperson data that entered the top ten in both January and February
3. Merge multiple tables
The top 10 sales data for multiple months are as follows, and the number of months will continue to increase over time.
top10Sales.xlsx
Find the products that have been listed in the top ten for all the past months
4. According to different sales channels, a certain merchant stores their sales records in two tables: online and store. Sometimes, both online and offline activities are held simultaneously, and some sales records are stored in two tables at the same time. The sales table structure is the same, as follows:
online
| OrderID | Customer | SellerId | OrderDate | Amount |
|---|---|---|---|---|
| 10400 | EASTC | 1 | 2014/1/1 | 3063 |
| 10401 | HANAR | 1 | 2014/1/1 | 3868.6 |
| 10402 | ERNSH | 8 | 2014/1/2 | 2713.5 |
| 10403 | ERNSH | 4 | 2014/1/3 | 1005.9 |
| 10404 | MAGAA | 2 | 2014/1/3 | 1675 |
store
| OrderID | Customer | SellerId | OrderDate | Amount |
|---|---|---|---|---|
| 10402 | ERNSH | 8 | 2014/1/2 | 2713.5 |
| 10403 | ERNSH | 4 | 2014/1/3 | 1005.9 |
| 10405 | TOMSP | 5 | 2014/1/3 | 2592 |
| 10406 | VICTE | 3 | 2014/1/4 | 252 |
| 10407 | SUPRD | 2 | 2014/1/5 | 100.8 |
(1) Please summarize order data both online and offline, and calculate the actual total sales revenue of the merchant
(2) Search for duplicate sales records saved both online and offline
5. Based on the different versions of the two transaction information files old.xlsx and new.xlsx, identify the newly added, deleted, and modified records.
old.xlsx:
| UserName | Date | SaleValue | SaleCount |
|---|---|---|---|
| Rachel | 2015/3/1 | 4500 | 9 |
| Rachel | 2015/3/3 | 8700 | 4 |
| Tom | 2015/3/2 | 3000 | 8 |
| Tom | 2015/3/3 | 5000 | 7 |
| Tom | 2015/3/4 | 6000 | 12 |
| John | 2015/3/2 | 4000 | 3 |
| John | 2015/3/2 | 4300 | 9 |
| John | 2015/3/4 | 4800 | 4 |
new.xlsx
| UserName | Date | SaleValue | SaleCount |
|---|---|---|---|
| Rachel | 2015/3/1 | 4500 | 9 |
| Rachel | 2015/3/2 | 5000 | 5 |
| Ashley | 2015/3/1 | 6000 | 5 |
| Rachel | 2015/3/3 | 11700 | 4 |
| Tom | 2015/3/3 | 5000 | 7 |
| Tom | 2015/3/4 | 6000 | 12 |
| John | 2015/3/2 | 4000 | 3 |
| John | 2015/3/2 | 4300 | 9 |
| John | 2015/3/4 | 4800 | 4 |
10.4 Join
1. There are Customers and Orders tables for a certain product
| id | name |
|---|---|
| 1 | Joe |
| 2 | Henry |
| 3 | Sam |
| 4 | Max |
Orders Table
| id | customerId | amount |
|---|---|---|
| 1 | 3 | 787 |
| 2 | 1 | 675 |
| 3 | 3 | 203 |
(1) Identify the names of customers who have purchased products and their total consumption
(2) Identify the list of customers who have not purchased products
2. There are two tables, namely the price table and inventory table for certain meat products. Now, it is necessary to horizontally concatenate the two tables.
Meats.xlsx
| Name | UnitPrice |
|---|---|
| Mutton | 7.69 |
| Pork | 4.58 |
| Chicken | 5.77 |
| Beef | 7.96 |
MeatStock.xlsx
| Name | Stock | MinimumStock |
|---|---|---|
| Mutton | 5000 | 3000 |
| Chicken | 4000 | 3000 |
| Duck | 2500 | 2000 |
| Beef | 3600 | 2000 |
(1) Join by Name, retain all rows after join
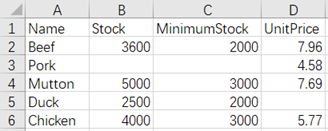
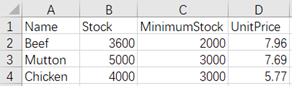
(2) Join by Name, keep only the rows that are present in both files
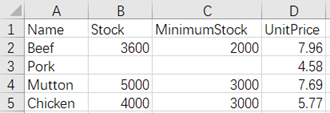
(3) Join by Name, keep the rows of the first file
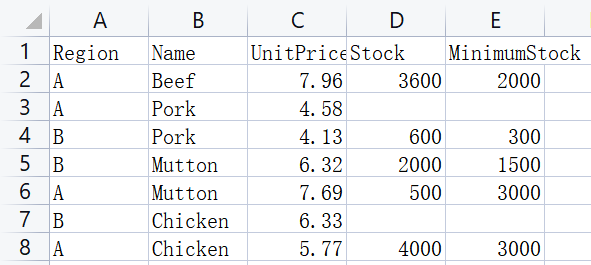
3. Join the following two tables by the Region and Name fields, keeping the rows of the first file
MeatsRegion.xlsx
| Region | Name | UnitPrice |
|---|---|---|
| A | Mutton | 7.69 |
| A | Pork | 4.58 |
| A | Chicken | 5.77 |
| A | Beef | 7.96 |
| B | Mutton | 6.32 |
| B | Pork | 4.13 |
| B | Chicken | 6.33 |
MeatRegionStock.xlsx
| Region | Name | Stock | MinimumStock |
|---|---|---|---|
| A | Mutton | 500 | 3000 |
| A | Chicken | 4000 | 3000 |
| A | Duck | 2500 | 2000 |
| A | Beef | 3600 | 2000 |
| B | Mutton | 2000 | 1500 |
| B | Pork | 600 | 300 |
| B | Beef | 3200 | 2000 |
Effect after join:
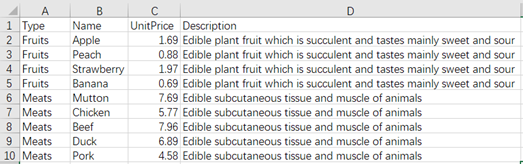
4. There are two tables
Types.xlsx
| Type | Description |
|---|---|
| Fruits | Edible plant fruit which is succulent and tastes mainly sweet and sour |
| Meats | Edible subcutaneous tissue and muscle of animals |
Foods.xlsx
| Type | Name | UnitPrice |
|---|---|---|
| Fruits | Apple | 1.69 |
| Fruits | Banana | 0.69 |
| Fruits | Peach | 0.88 |
| Fruits | Strawberry | 1.97 |
| Meats | Mutton | 7.69 |
| Meats | Pork | 4.58 |
| Meats | Chicken | 5.77 |
| Meats | Duck | 6.89 |
| Meats | Beef | 7.96 |
Join by Type and add Description after each type of food
Effect after join:
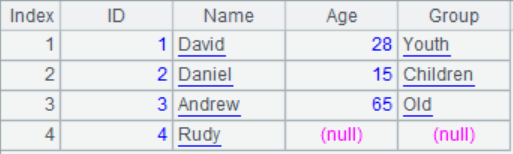
5. According to the community personnel table and age segmentation table, query the age group of community residents. (Implemented using xjoin())
Community:
| ID | Name | Age |
|---|---|---|
| 1 | David | 28 |
| 2 | Daniel | 15 |
| 3 | Andrew | 65 |
| 4 | Rudy |
Age:
| Group | Start | End |
|---|---|---|
| Children | 0 | 15 |
| Youth | 16 | 40 |
| Middle | 41 | 60 |
| Old | 61 | 100 |
Query effect:
Suggested answers
10.1 Primary key
1.
| A | |
|---|---|
| 1 | =T(“Sales.xlsx”) |
| 2 | =A1.keys(ID) |
| 3 | =A1(2).key() |
| 4 | >A1.index() |
| 5 | =A1.find(10010002,20010004,30020008) |
| 6 | =A1.keys() |
| 7 | =A1.keys(ID,Name) |
| 8 | =A1.find([20010005,“Ham”]) |
10.2 Foreign key
1.
| A | |
|---|---|
| 1 | =T(“Person.xlsx”).keys(personId) |
| 2 | =T(“Address.xlsx”).keys(addressId) |
| 3 | >A2.switch(personId,A1) |
| 4 | =A2.new(addressId,personId.lastName:lastName,city,state) |
2.
| A | |
|---|---|
| 1 | =T(“Customers.xlsx”).keys(id) |
| 2 | =T(“Orders”).keys(id) |
| 3 | >A2.switch(customerId,A1) |
| 4 | =A2.(customerId.name).id() |
| A | |
|---|---|
| 1 | =T(“Customers.xlsx”).keys(id) |
| 2 | =T(“Orders”).keys(id) |
| 3 | =A2.join(customerId,A1,name).(name).id() |
3.
| A | |
|---|---|
| 1 | =T(“Customers.xlsx”).keys(id) |
| 2 | =T(“Orders”).keys(id) |
| 3 | =A2.group(customerId;) |
| 4 | =A1.join@d(id,A3:customerId) |
4.
| A | |
|---|---|
| 1 | =T(“Employee”).keys(id) |
| 2 | =T(“Department”).keys(id) |
| 3 | =A1.join(departmentId,A2,name:deptname) |
| 4 | =A3.group(deptname;~.maxp@a(salary).(name):name,~.max(salary):salary) |
5.
(1)
| A | |
|---|---|
| 1 | =T(“Orders.xlsx”) |
| 2 | =T(“Order_detail.xlsx”) |
| 3 | =A2.groups(OrderID;sum(Price*Quantity):Amount).select(Amount>1000) |
| 4 | =A1.join@i(OrderID,A3:OrderID) |
(2)
| A | |
|---|---|
| 1 | =T(“Orders.xlsx”) |
| 2 | =T(“Order_detail.xlsx”) |
| 3 | =A1.select(Area==“north”) |
| 4 | =A2.join@i(OrderID,A3:OrderID) |
6.
| A | |
|---|---|
| 1 | =T(“Freight.xlsx”) |
| 2 | =T(“Orders.xlsx”) |
| 3 | =A2.join(City,A1:City,First1KG+(ceil(WeightKG)-1)*Add1KG:Fee) |
7.
| A | |
|---|---|
| 1 | =T(“Meal.xlsx”) |
| 2 | =T(“Charge.xlsx”) |
| 3 | =A1.join(Mealtype, A2:Mealtype, Mealcharge) |
8.
| A | |
|---|---|
| 1 | =T(“Quantity.xlsx”) |
| 2 | =T(“Price.xlsx”) |
| 3 | =A1.derive(A2.segp@r(StartQuantity,Quantity).Price:Price) |
10.3 Merge
1.
(1)
| A | |
|---|---|
| 1 | =T(“2018.xlsx”) |
| 2 | =T(“2019.xlsx”) |
| 3 | =[A1,A2].merge@io(CustomerID,ProductID) |
(2)
| A | |
|---|---|
| 1 | =T(“2018.xlsx”) |
| 2 | =T(“2019.xlsx”) |
| 3 | =[A1,A2].merge@o(OrderID) |
| 4 | =A3.groups(CustomerID;sum(Amount):TotalAmount) |
(3)
| A | |
|---|---|
| 1 | =T(“2018.xlsx”) |
| 2 | =T(“2019.xlsx”) |
| 3 | =A2.id(CustomerID)\A1.id(CustomerID) |
| 4 | =A2.select(A3.contain(CustomerID)) |
(4)
| A | |
|---|---|
| 1 | =T(“2018.xlsx”) |
| 2 | =T(“2019.xlsx”) |
| 3 | =A1.id(CustomerID)\A2.id(CustomerID) |
2.
| A | |
|---|---|
| 1 | =T(“Jan.xlsx”) |
| 2 | =T(“Feb.xlsx”) |
| 3 | =[A1,A2].merge@oi(ProductName) |
| 4 | =[A1,A2].merge@ou(ProductName) |
| 5 | =[A1,A2].merge@od(ProductName) |
| 6 | =[A1,A2].merge@oi() |
3.
| A | |
|---|---|
| 1 | =file(“top10Sales.xlsx”).xlsopen() |
| 2 | =A1.(A1.xlsimport@t(;stname)).merge@oi(ProductName) |
4.
(1)
| A | |
|---|---|
| 1 | =T(“Online.xlsx”) |
| 2 | =T(“Store.xlsx”) |
| 3 | =A1.sort(OrderID) |
| 4 | =A2.sort(OrderID) |
| 5 | =[A3,A4].merge@u(OrderID) |
| 6 | =A5.sum(Amount) |
(2)
| A | |
|---|---|
| 1 | =T(“Online.xlsx”) |
| 2 | =T(“Store.xlsx”) |
| 3 | =A1.sort(OrderID) |
| 4 | =A2.sort(OrderID) |
| 5 | =[A3,A4].merge@i(OrderID) |
5.
| A | |
|---|---|
| 1 | =T(“old.xlsx”) |
| 2 | =T(“new.xlsx”) |
| 3 | =A1.sort(UserName,Date) |
| 4 | =A2.sort(UserName,Date) |
| 5 | =new=[A4,A3].merge@d(UserName,Date) |
| 6 | =delete=[A3,A4].merge@d(UserName,Date) |
| 7 | =diff=[A4,A3].merge@d(UserName,Date,SaleValue,SaleCount) |
| 8 | =update=[diff,new].merge@d(UserName,Date) |
| 9 | return [new, delete, update] |
10.4 Join
1.
(1)
| A | |
|---|---|
| 1 | =T(“Customers.xlsx”) |
| 2 | =T(“Orders”) |
| 3 | =A2.groups(customerId;sum(amount):Amount) |
| 4 | =join(A1:a,id;A3:b,customerId) |
| 5 | =A4.new(a.name,b.Amount) |
(2)
| A | |
|---|---|
| 1 | =T(“Customers.xlsx”) |
| 2 | =T(“Orders”) |
| 3 | =A2.groups(customerId) |
| 4 | =join@d(A1:a,id;A3:b,customerId) |
2.
(1)
| A | |
|---|---|
| 1 | =file(“Meats.xlsx”).xlsimport@t() |
| 2 | =file(“MeatStock.xlsx”).xlsimport@t() |
| 3 | =join@f(A1:Price,Name;A2:Stock,Name) |
| 4 | =A3.new([Price.Name,Stock.Name].ifn():Name,Stock.Stock,Stock.MinimumStock,Price.UnitPrice) |
| 5 | =file(“MeatsPriceStock.xlsx”).xlsexport@t(A4) |
(2)
| A | |
|---|---|
| 1 | =file(“Meats.xlsx”).xlsimport@t() |
| 2 | =file(“MeatStock.xlsx”).xlsimport@t() |
| 3 | =join(A1:Price,Name;A2:Stock,Name) |
| 4 | =A3.new(Stock.Name,Stock.Stock,Stock.MinimumStock,Price.UnitPrice) |
| 5 | =file(“MeatsPriceStock.xlsx”).xlsexport@t(A4) |
(3)
| A | |
|---|---|
| 1 | =file(“Meats.xlsx”).xlsimport@t() |
| 2 | =file(“MeatStock.xlsx”).xlsimport@t() |
| 3 | =join@1(A1:Price,Name;A2:Stock,Name) |
| 4 | =A3.new(Price.Name,Stock.Stock,Stock.MinimumStock,Price.UnitPrice) |
| 5 | =file(“MeatsPriceStock.xlsx”).xlsexport@t(A4) |
3.
| A | |
|---|---|
| 1 | =file(“MeatsRegion.xlsx”).xlsimport@t() |
| 2 | =file(“MeatRegionStock.xlsx”).xlsimport@t() |
| 3 | =join@1(A1:Price,Region,Name;A2:Stock,Region,Name) |
| 4 | =A3.new(Price.Region,Price.Name,Stock.Stock,Stock.MinimumStock,Price.UnitPrice) |
| 5 | =file(“MeatsPriceStock.xlsx”).xlsexport@t(A4) |
4.
| A | |
|---|---|
| 1 | =T(“Types.xlsx”) |
| 2 | =T(“Foods.xlsx”) |
| 3 | =join@f(A1:Type,Type;A2:Food,Type) |
| 4 | =A3.new(Food.Type,Food.Name,Food.UnitPrice,Type.Description) |
| 5 | =T(“FoodsDescription.xlsx”,A4) |
5.
| A | |
|---|---|
| 1 | =T(“Community.xlsx”) |
| 2 | =T(“Age.xlsx”) |
| 3 | =xjoin@1(A1:Person; A2:Age, A2.Start<=Person.Age && A2.End>=Person.Age) |
| 4 | =A3.new(Person.ID:ID, Person.Name:Name, Person.Age:Age,Age.Group:Group) |
SPL Official Website 👉 https://www.scudata.com
SPL Feedback and Help 👉 https://www.reddit.com/r/esProcSPL
SPL Learning Material 👉 https://c.scudata.com
SPL Source Code and Package 👉 https://github.com/SPLWare/esProc
Discord 👉 https://discord.gg/2bkGwqTj
Youtube 👉 https://www.youtube.com/@esProc_SPL


Chinese version